Graphics output
Andrew Irwin, a.irwin@dal.ca
2026-04-01
Kinds of graphics
Vector graphics (pdf, svg)
Bitmapped or raster graphics (png, jpeg)
-
Why does it matter?
File sizes
Quality when printed
Appearance on screen
Overview
Device types: png, ragg, jpeg, svg, pdf
Size: fig.height, fig.width (in inches, default 7), and fig.asp (aspect ratio: height / width)
Display size: out.width, out.height (in percentage of display area, e.g., ‘70%’)
Resolution: dpi (dots per inch; 96-250 on screen, 300-600 when printed)
Alignment: fig.align = left, right, center
Chunk options
R markdown:
```{r fig.height = 5, fig.asp = 0.6}
# code for plot here
```
Quarto document (as above, or…)
```{r}
#| fig.height: 5
#| fig.asp: 0.5
# code for plot here
```
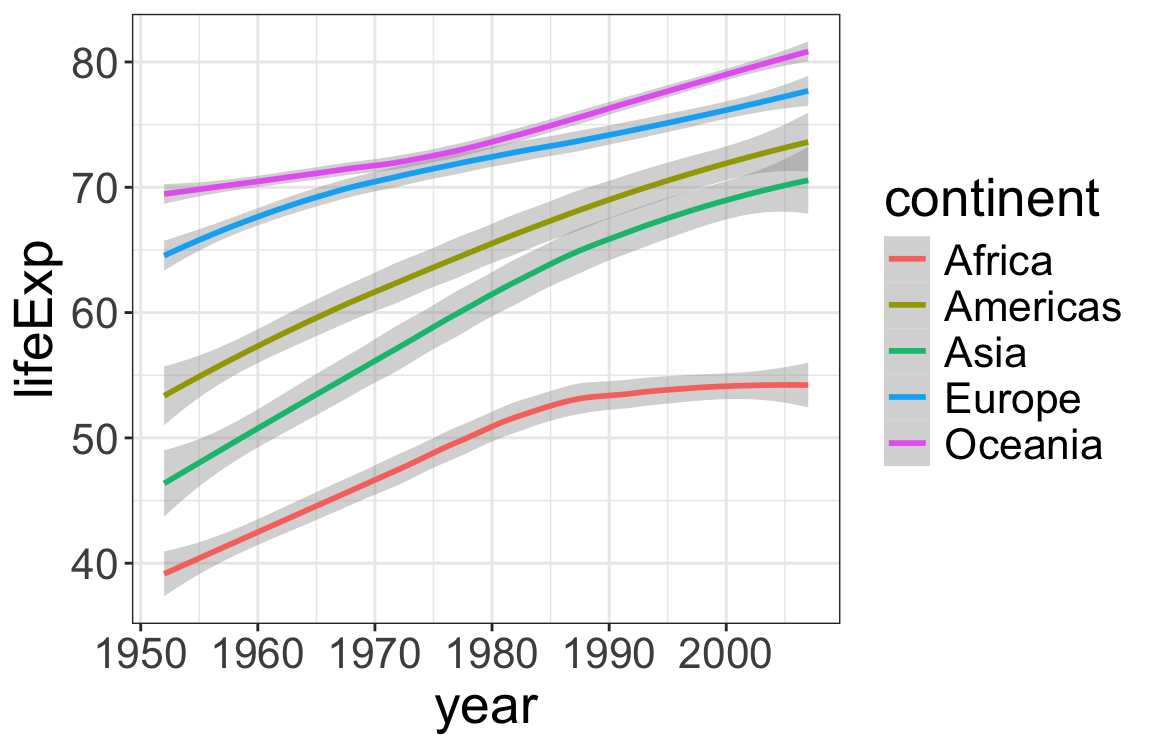
PNG example
Chunk options: fig.width = 6, fig.asp = 0.65, fig.align="center", out.width = '70%', dev = 'png'
![]()
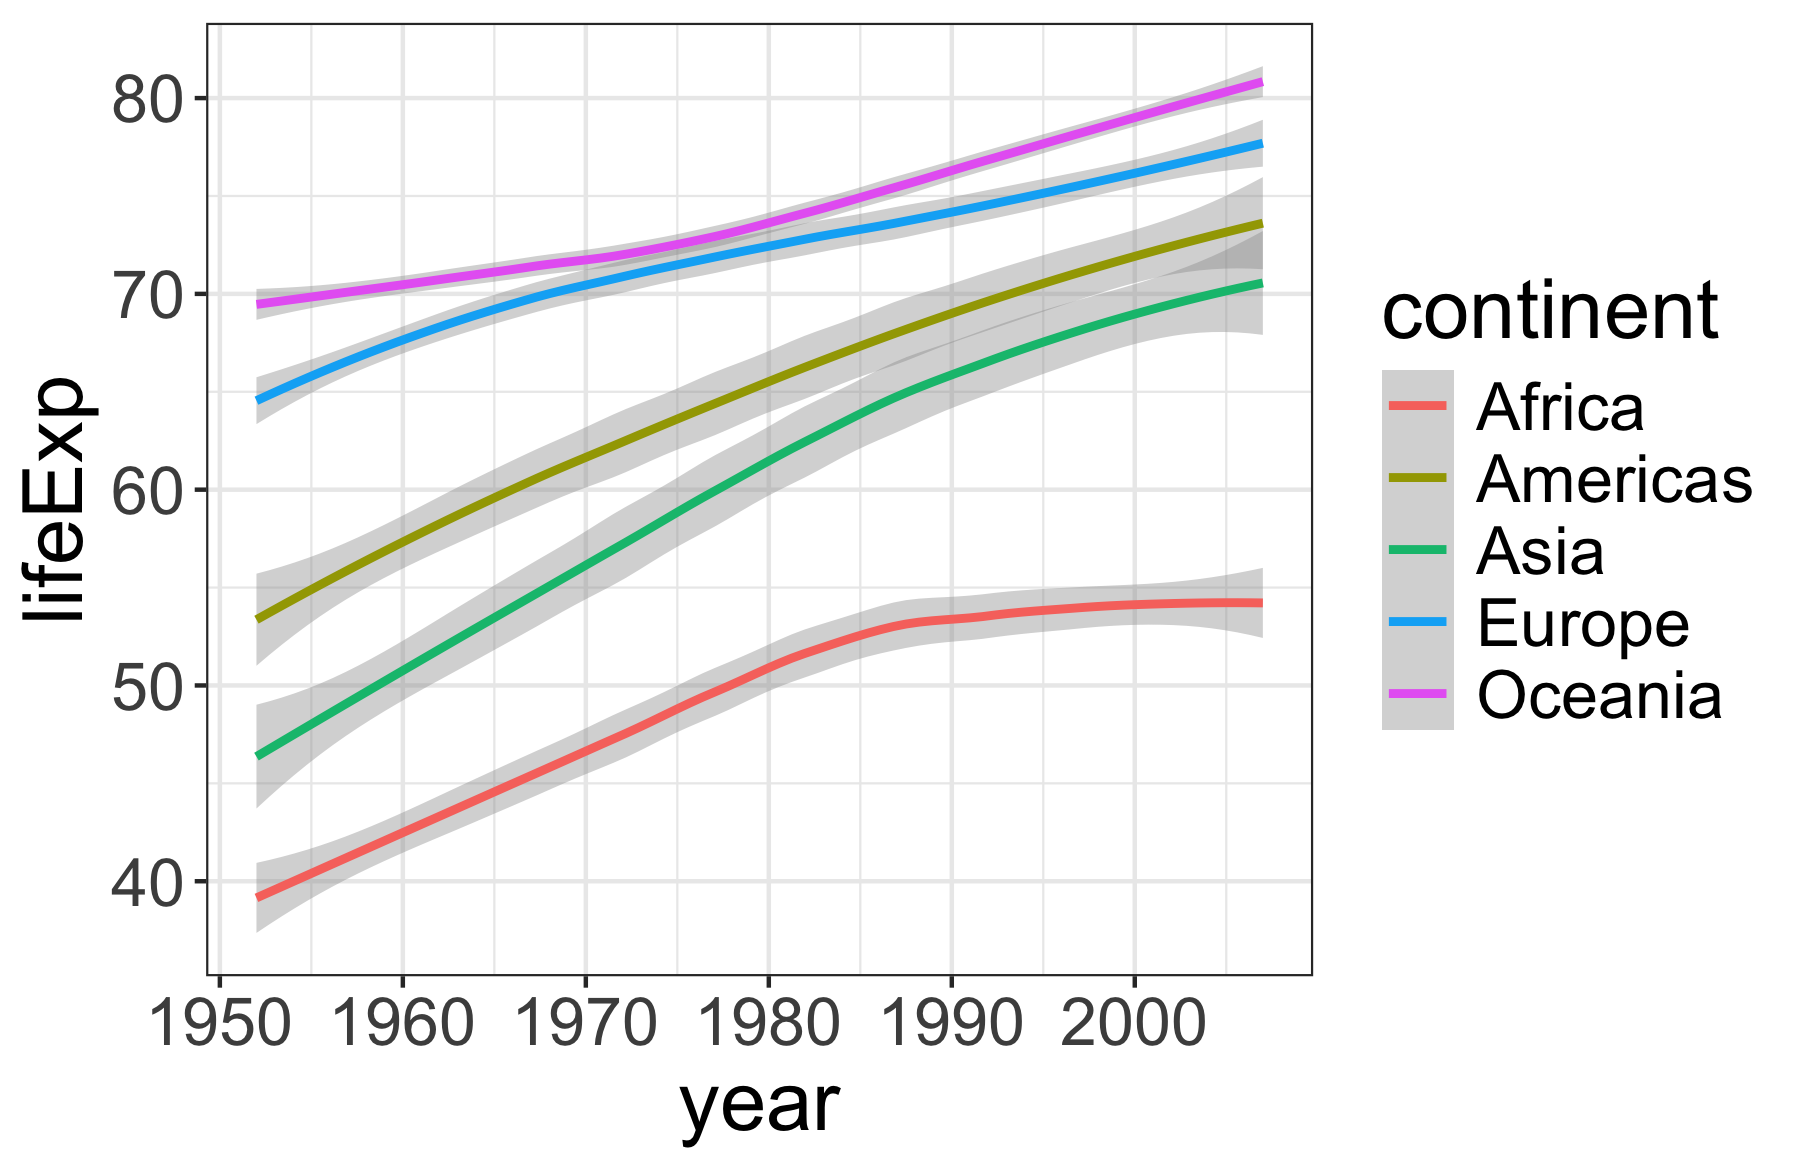
Higher resolution PNG example
Chunk options: dev='png', dpi=150
![]()
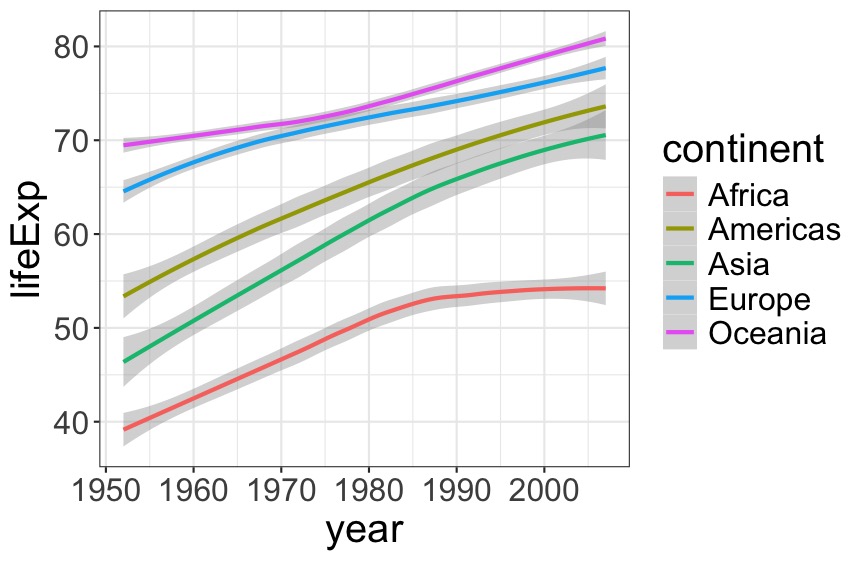
JPEG example
Chunk options: dev='jpeg', dpi = 72
![]()
SVG example
Chunk options: dev='svglite'
![]()
Creating standalone files
Use ggsave:
ggsave("test-plot.pdf", p1, height = 4, width = 6)
ggsave("test-plot.png", p1, dpi = 400)
ggsave("test-plot.svg", p1)