Making slide presentations

Andrew Irwin, a.irwin@dal.ca

2024-03-12

Goals

  • Why do we make slides?
  • Introduction to the most important tools for making slides with R

What are slides for?

  • An aid to oral communication
    • Usually a small amount of text and a “display item” (figure, table, equation, code)
    • Designed to help you communicate a specific point
  • Visualizations on slides differ from reports
    • Large text, bold colours, material tailored to presentation

Create a template

Rstudio menu:

  • File
    • New File…
      • Quarto presentation
        • Check “RevealJS”

Documentation

Essentials

Like R markdown, but use two hashes (##) to start a slide and make a title at the top.

A heading with single hash mark makes a vertically-centred title

Use three minus signs (---) to start a new slide with no title.

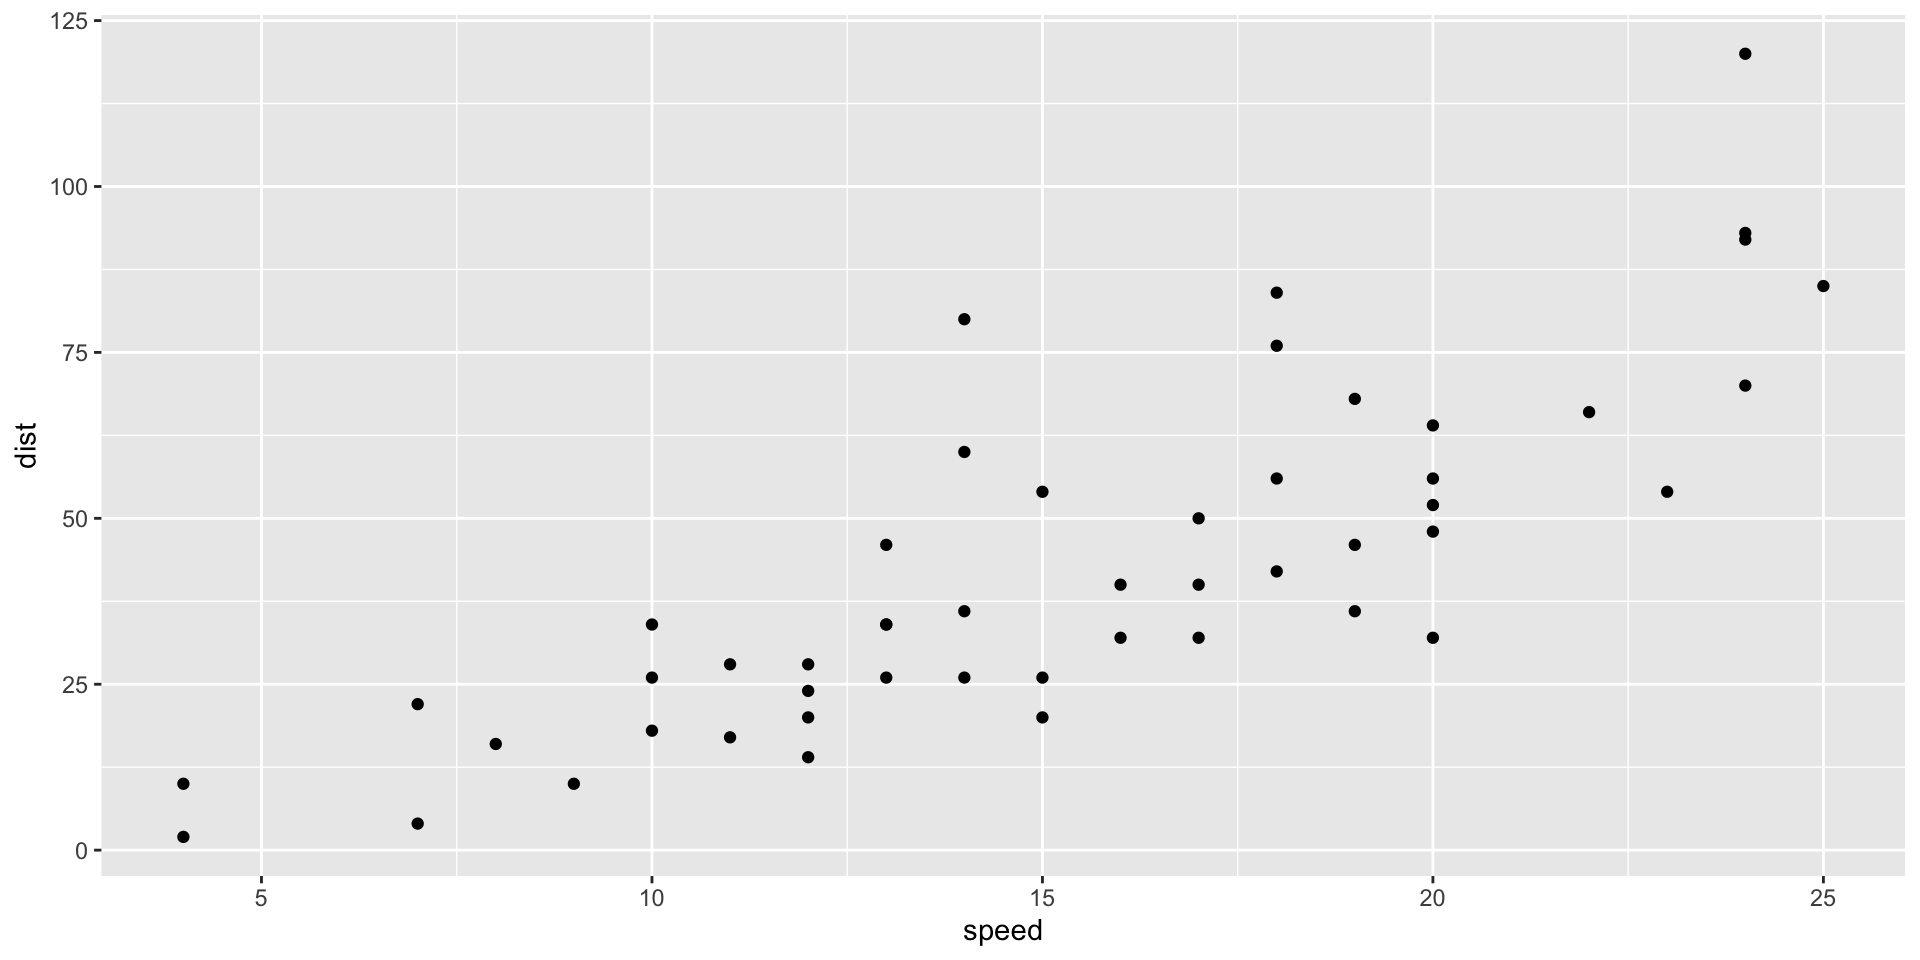
Stopping distance increases with car speed

Show computer code

Use echo=TRUE.

cars |> ggplot(aes(speed, dist)) + geom_point()

Formatting text and adding images

All markdown formatting for italics, bold, hyperlinks are available.

You can include images.

A kitten

Two column format

mpg |> count(class)
class n
2seater 5
compact 47
midsize 41
minivan 11
pickup 33
subcompact 35
suv 62
The number of observations tabulated by class of car.

Summary

  • I’ve shown a simple set of slides you can easily make using Rstudio and Quarto/RevealJS (very similar to R markdown)

  • Your slides should use large text and images

  • Use formatting (see lesson on reproducible reports) to control how code and visualizations are displayed

  • A link to the full code for these slides