Working with models
2026-02-10
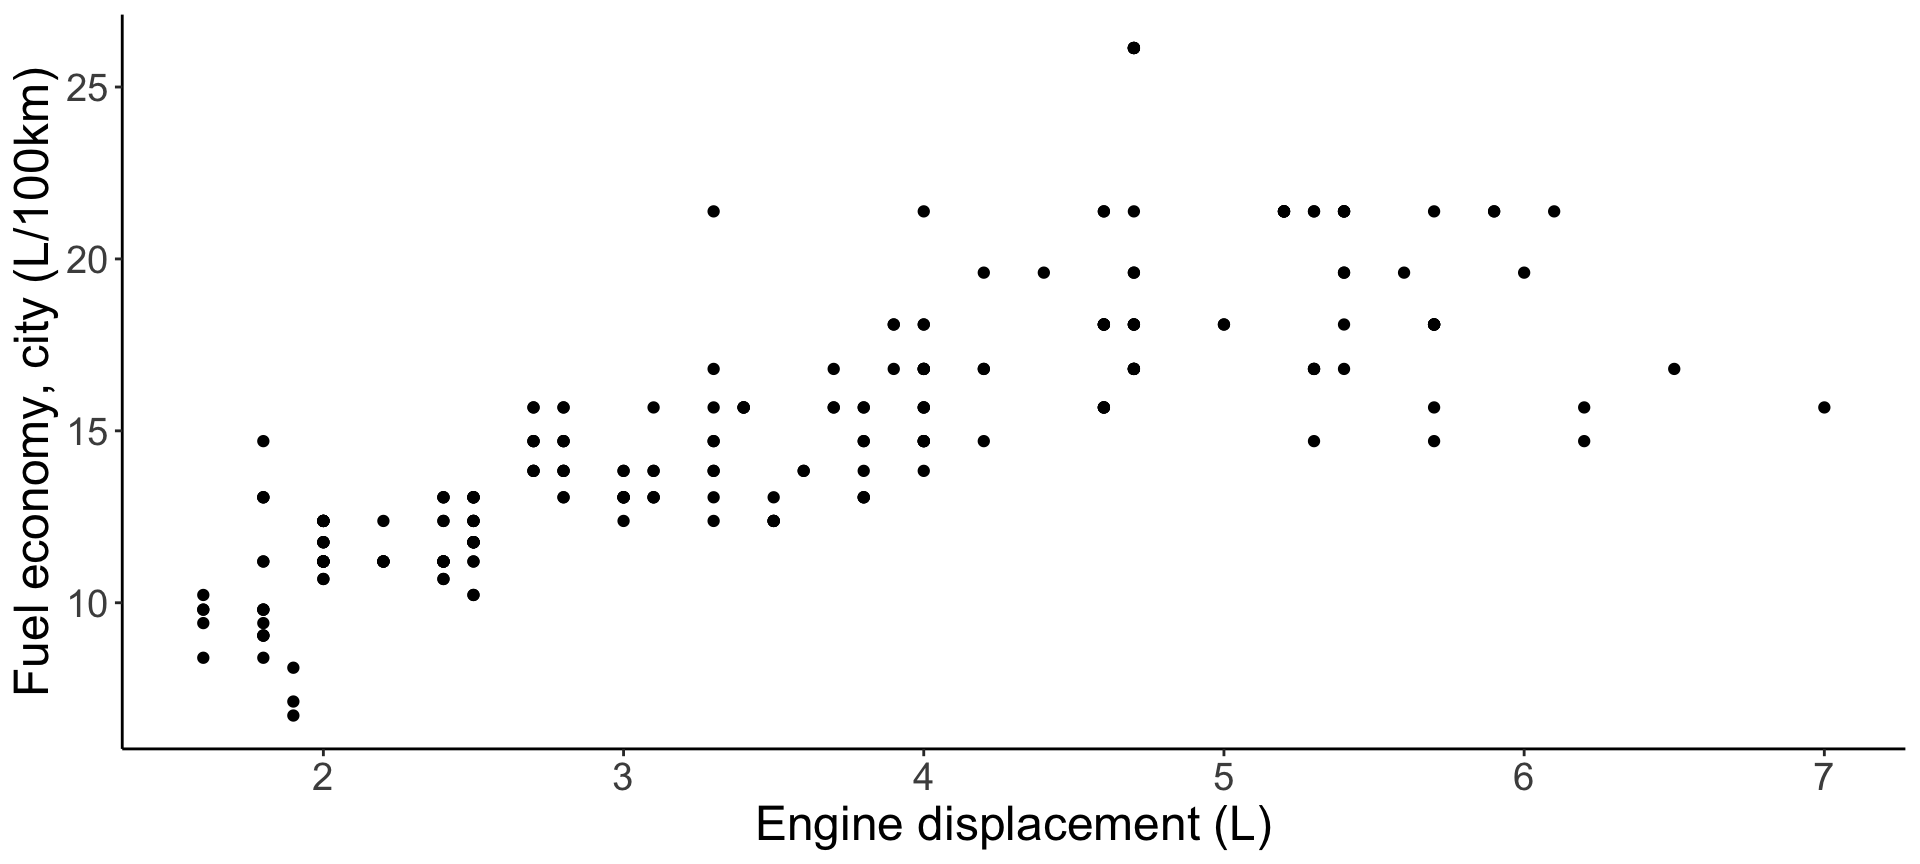
Start with a basic graph
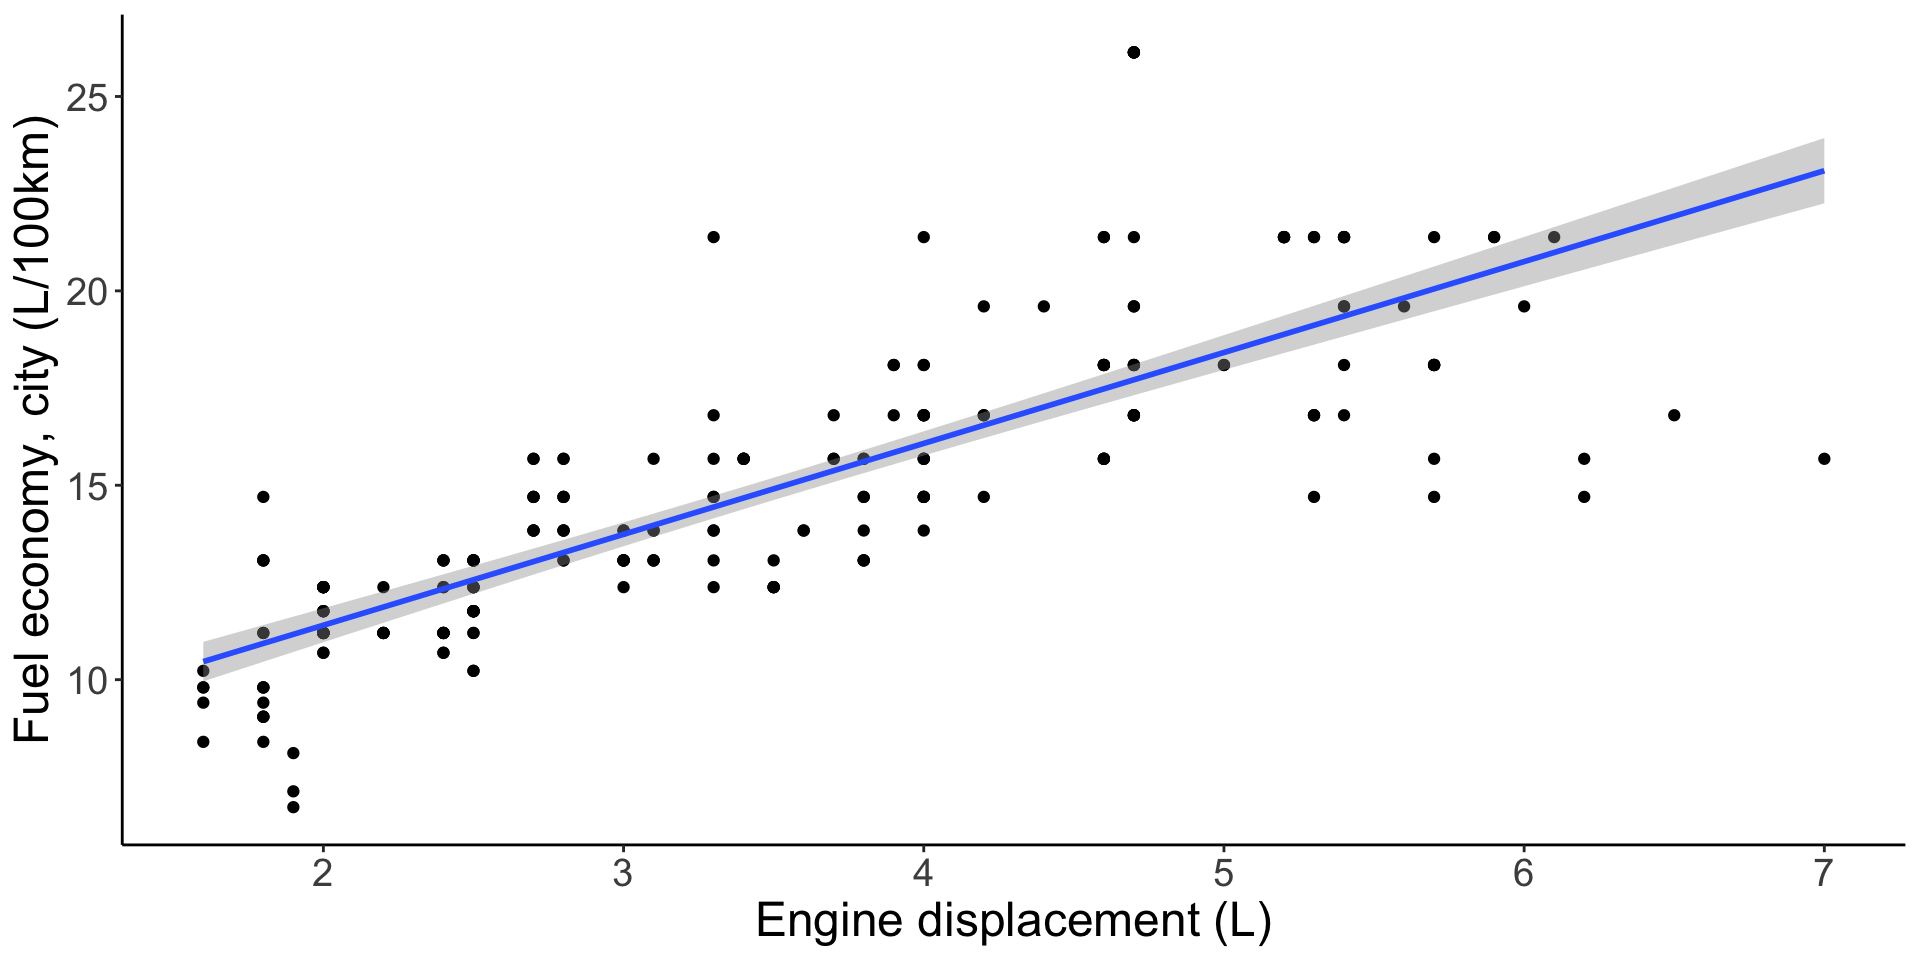
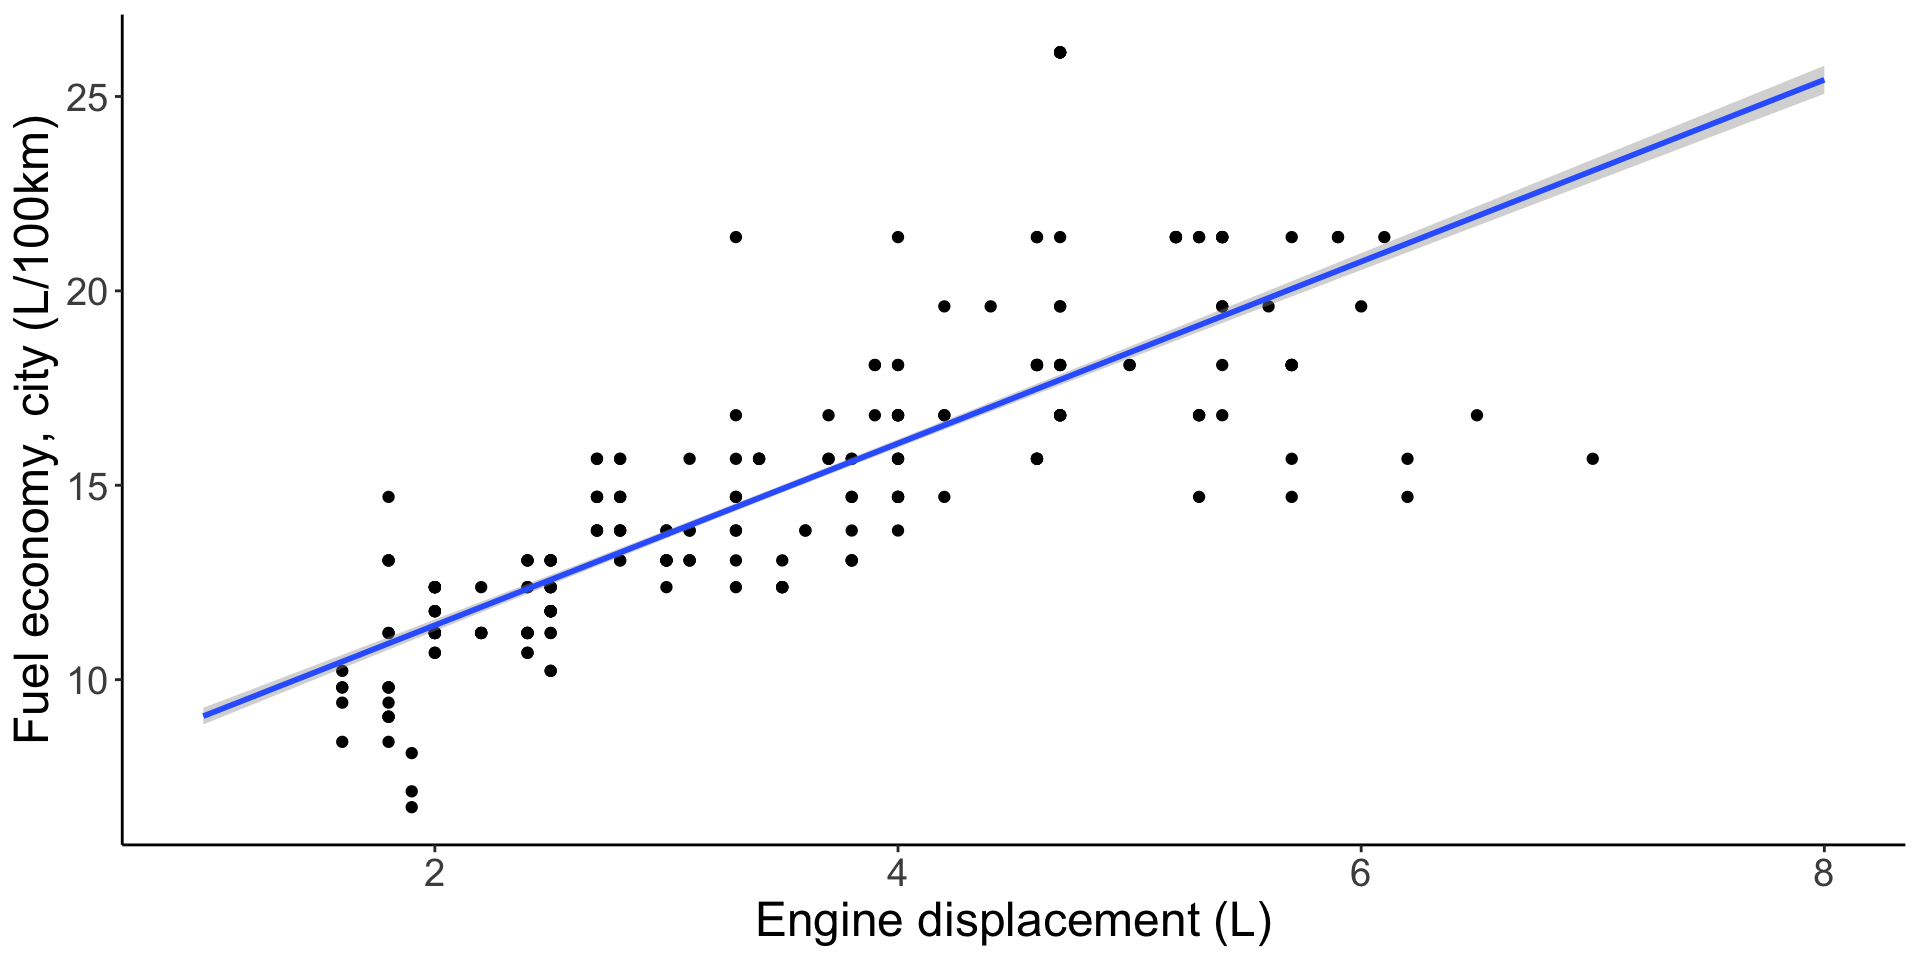
Add a regression line
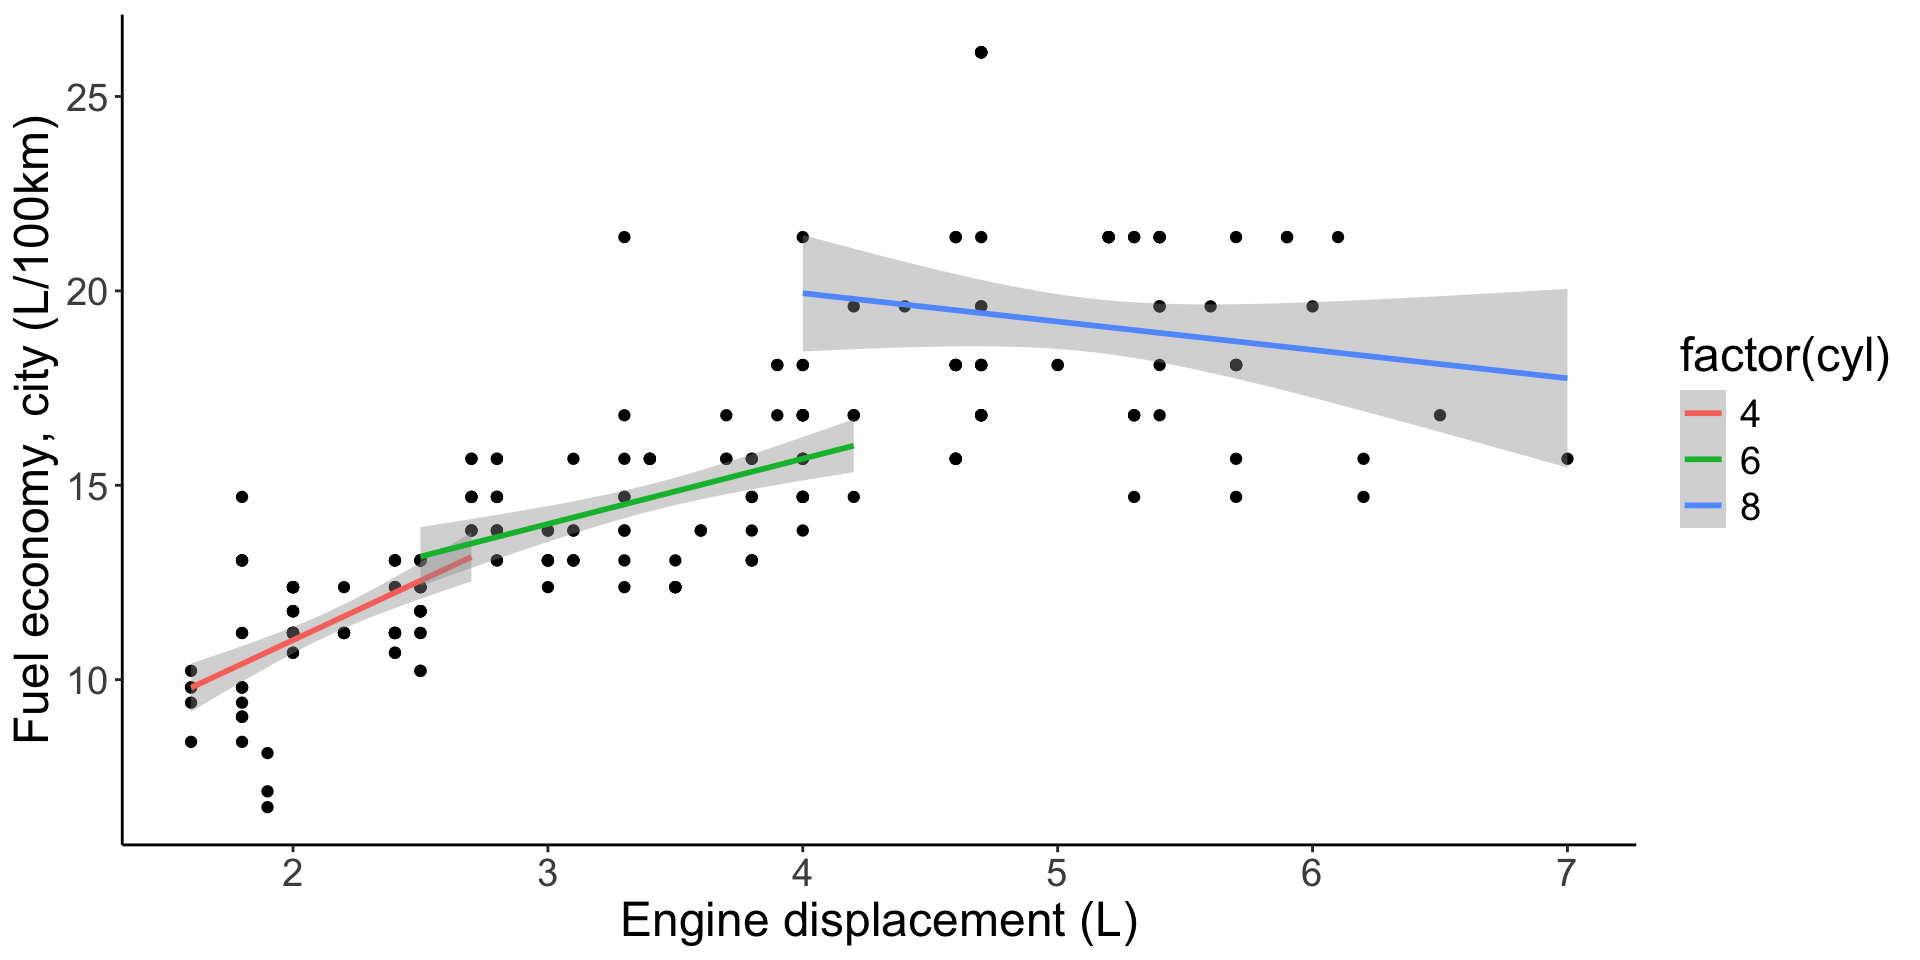
Add a regression line for each group
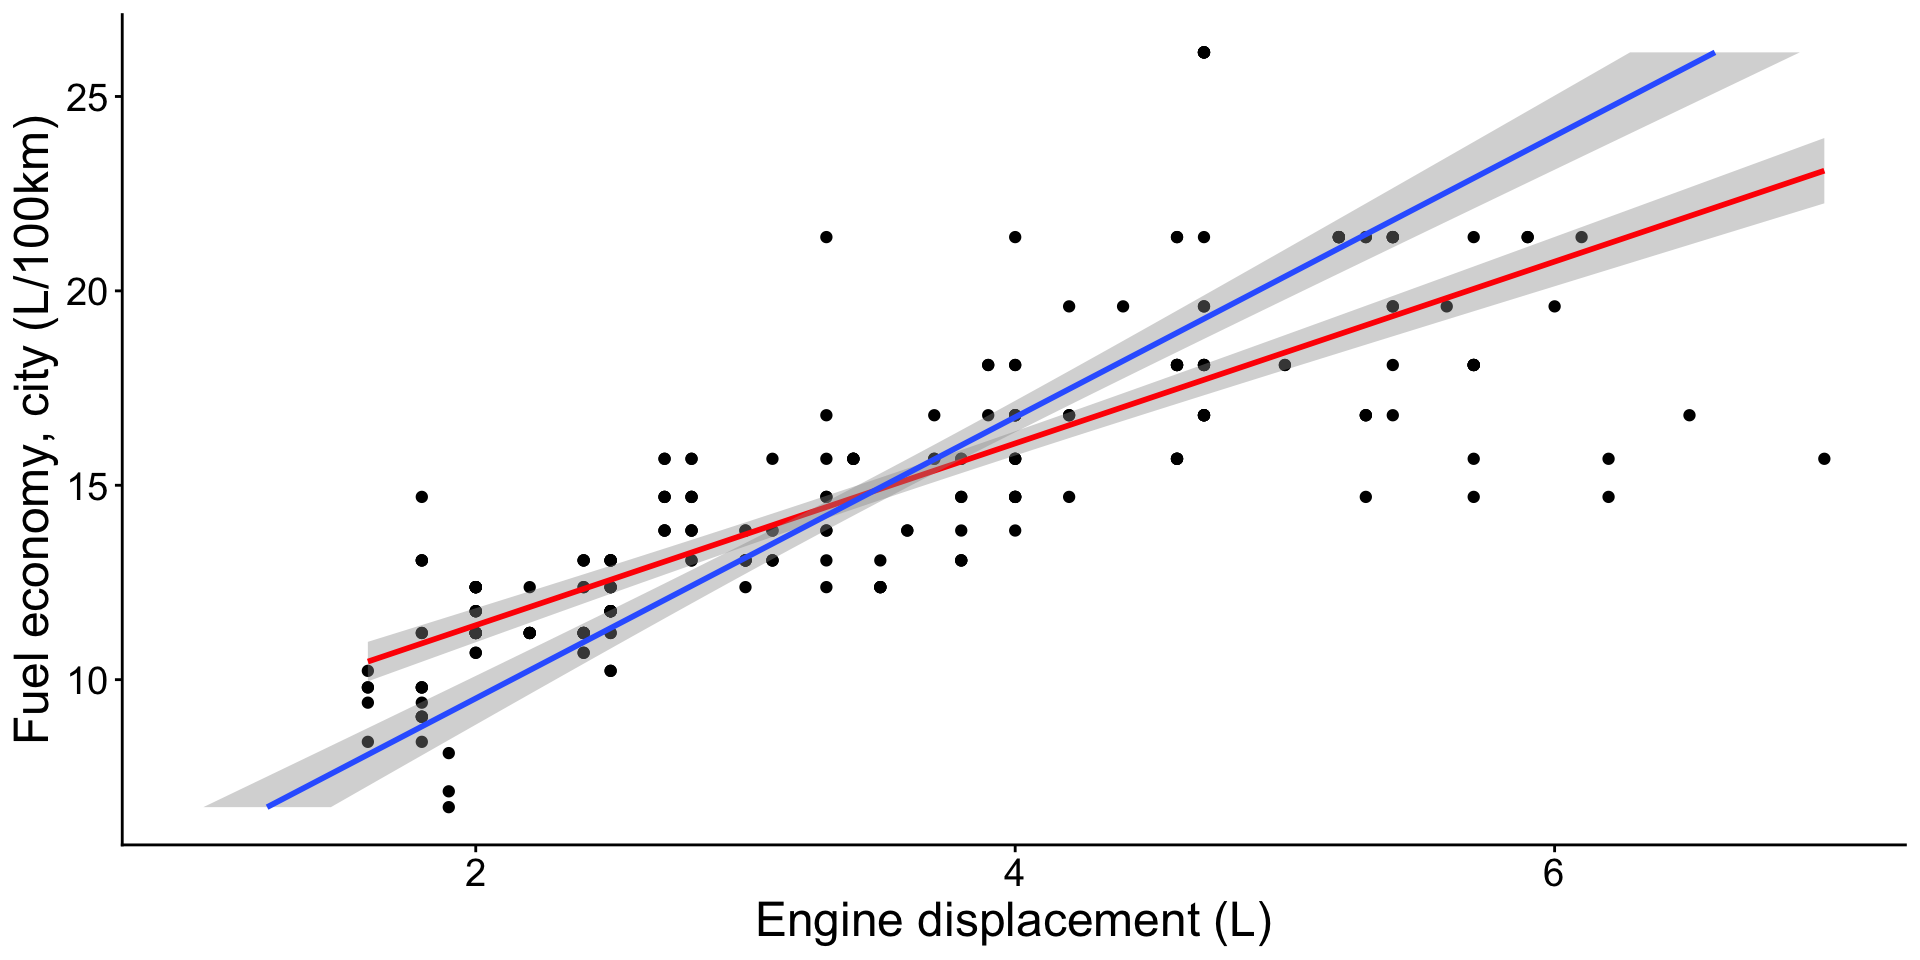
Add one regression line, colour by group
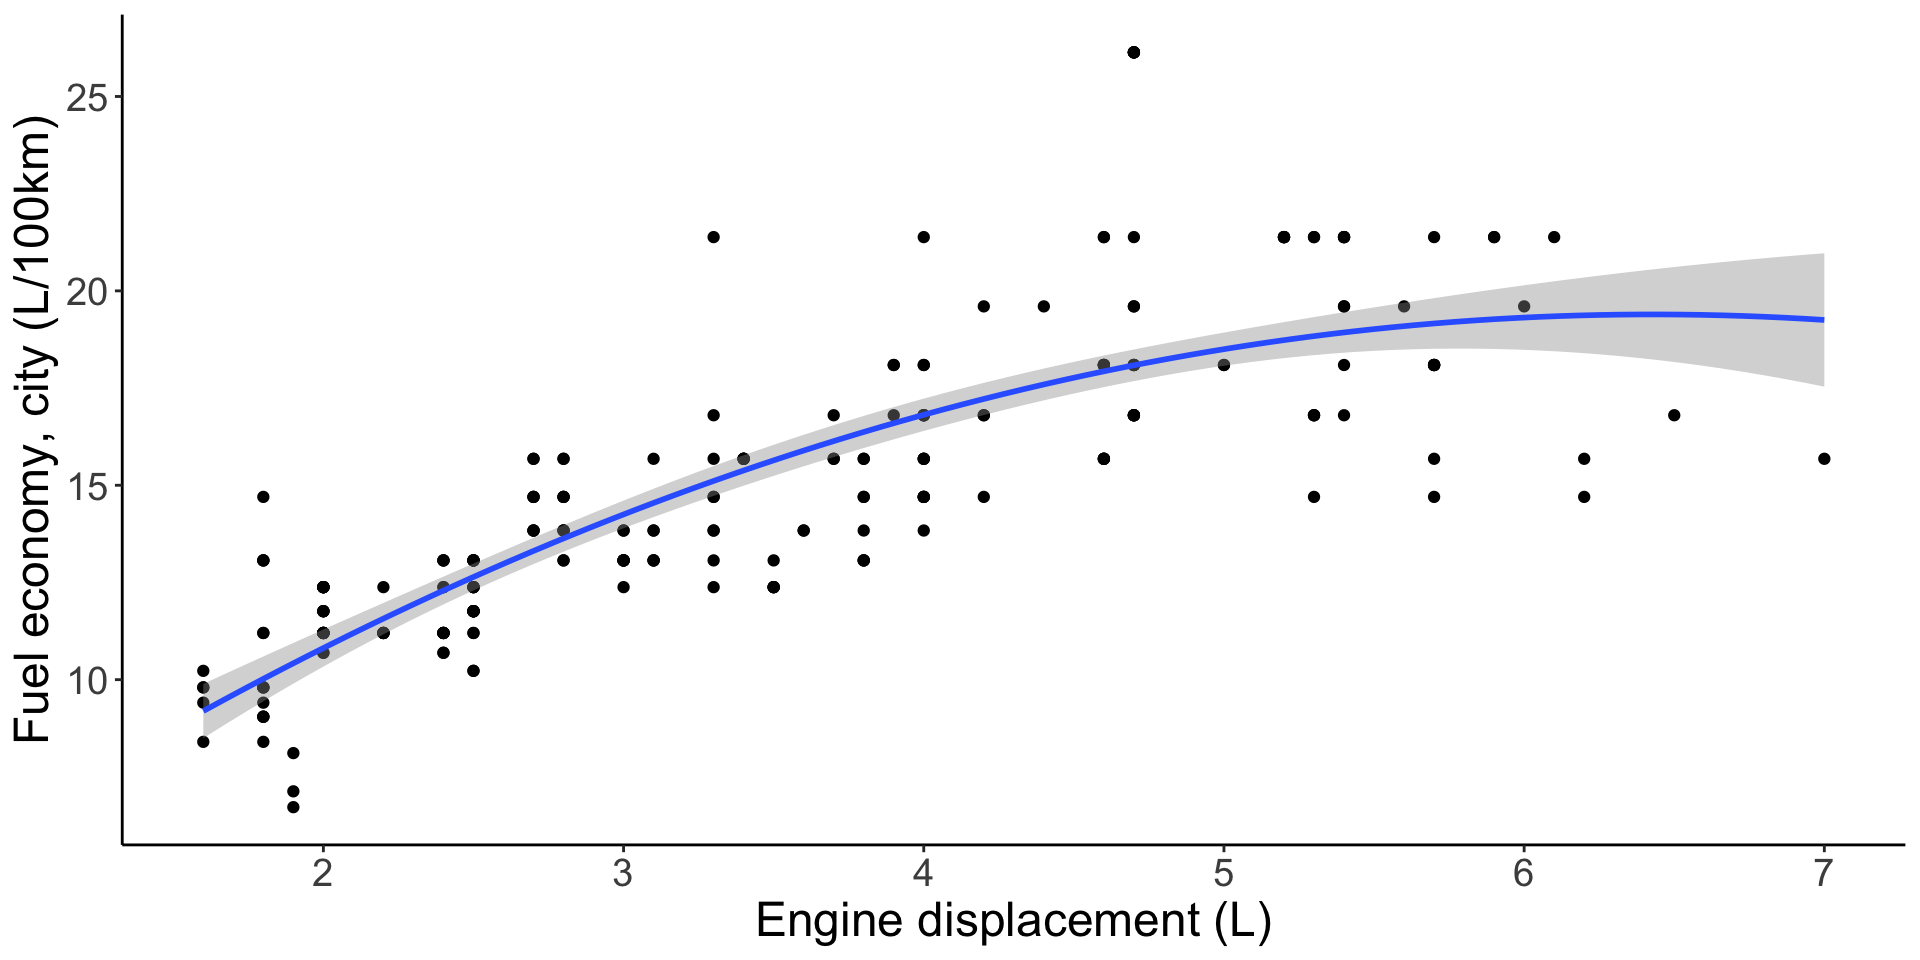
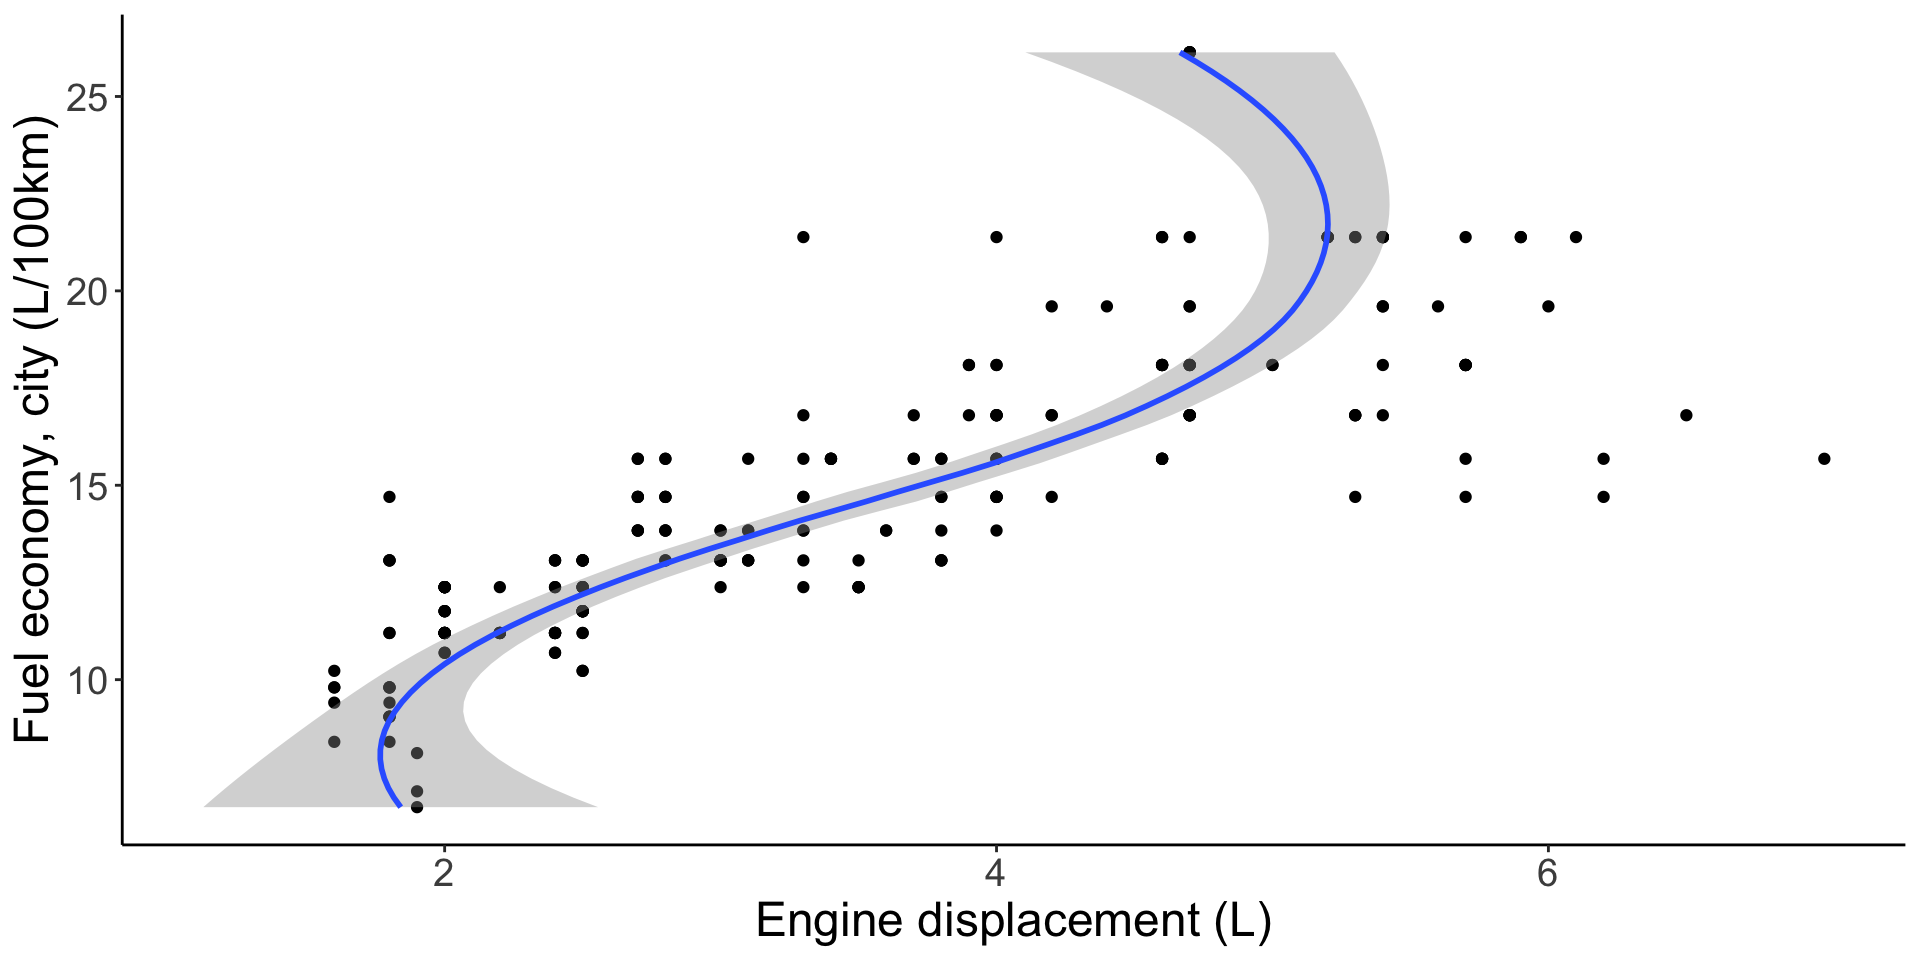
Polynomial regression
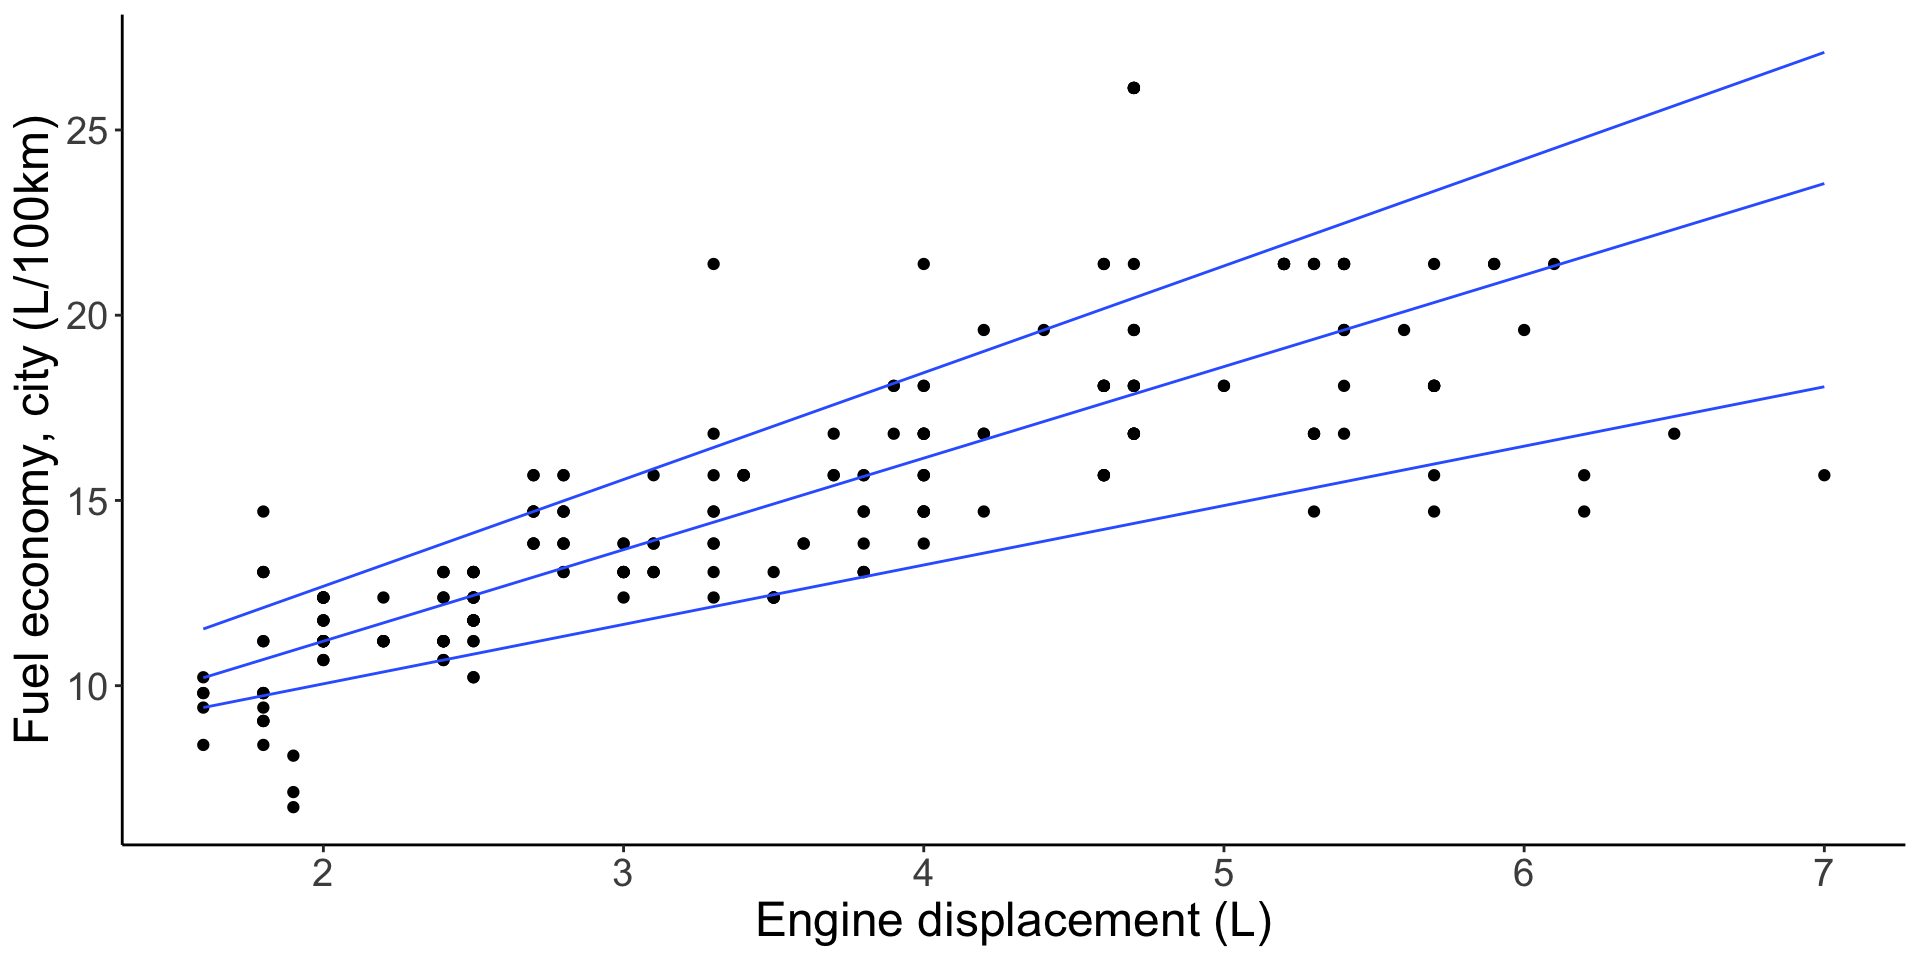
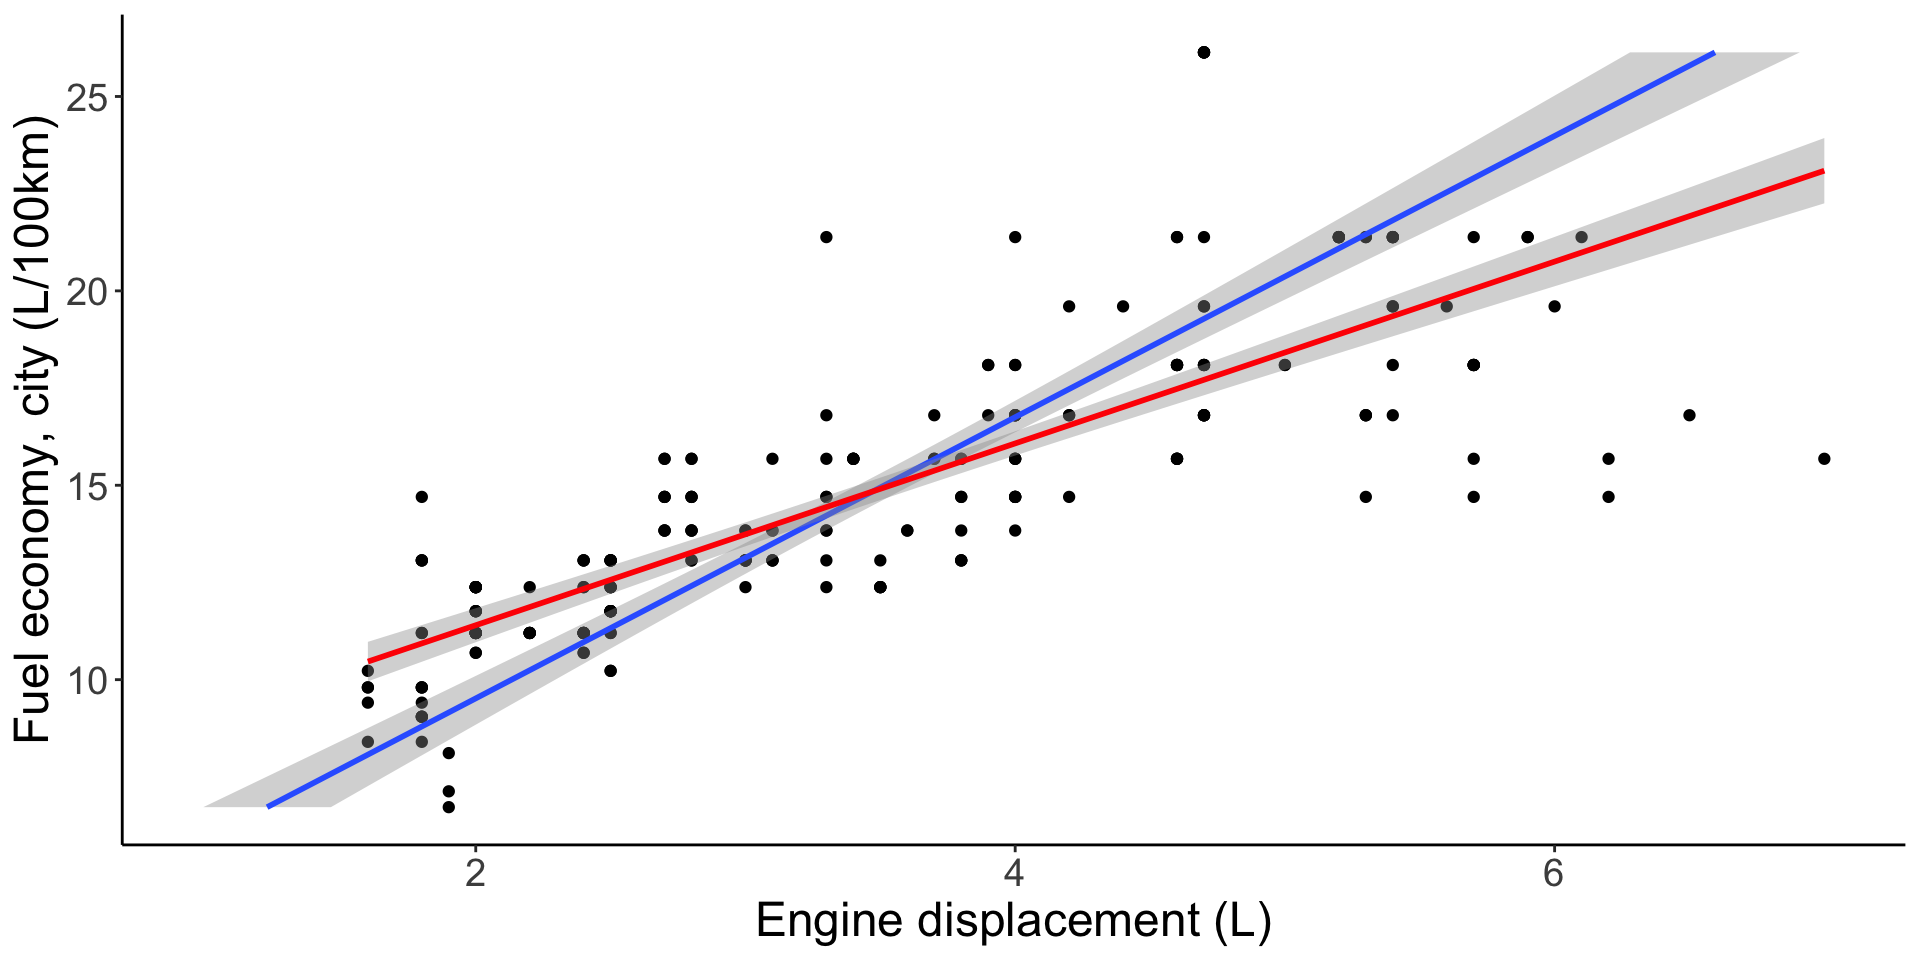
Quantile regression
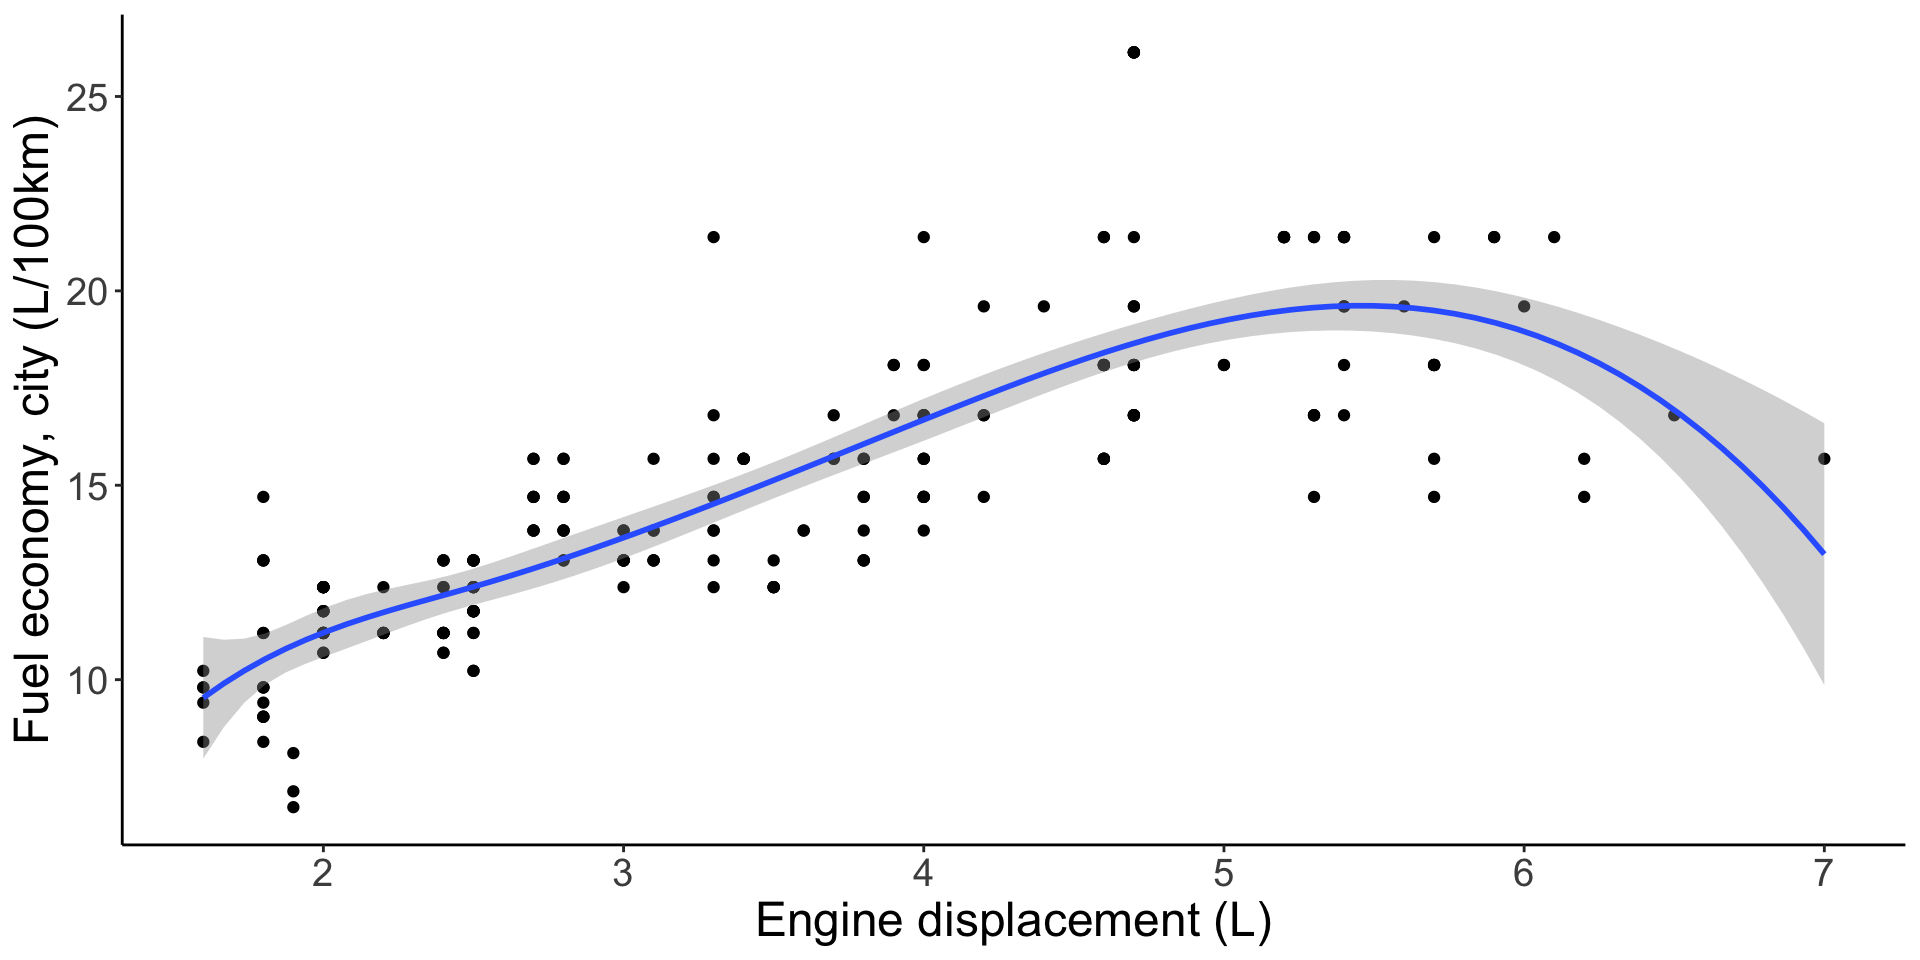
Smoothing spline
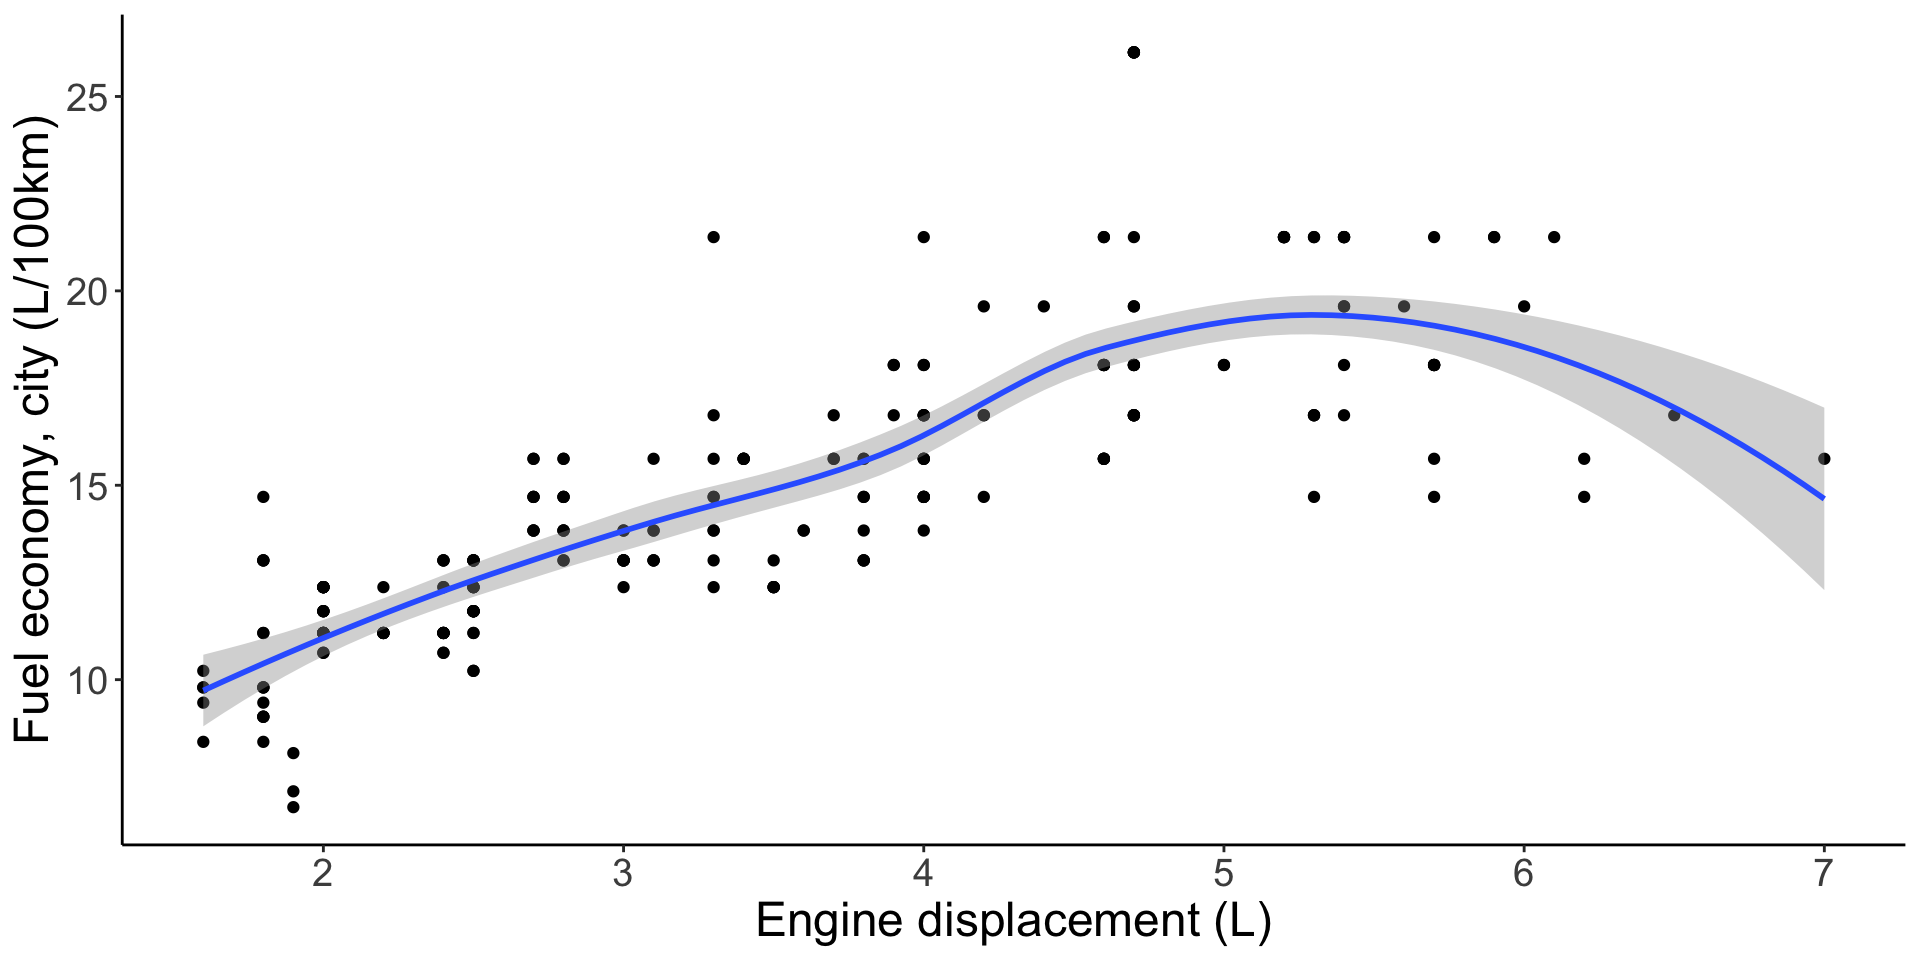
Generalized additive model
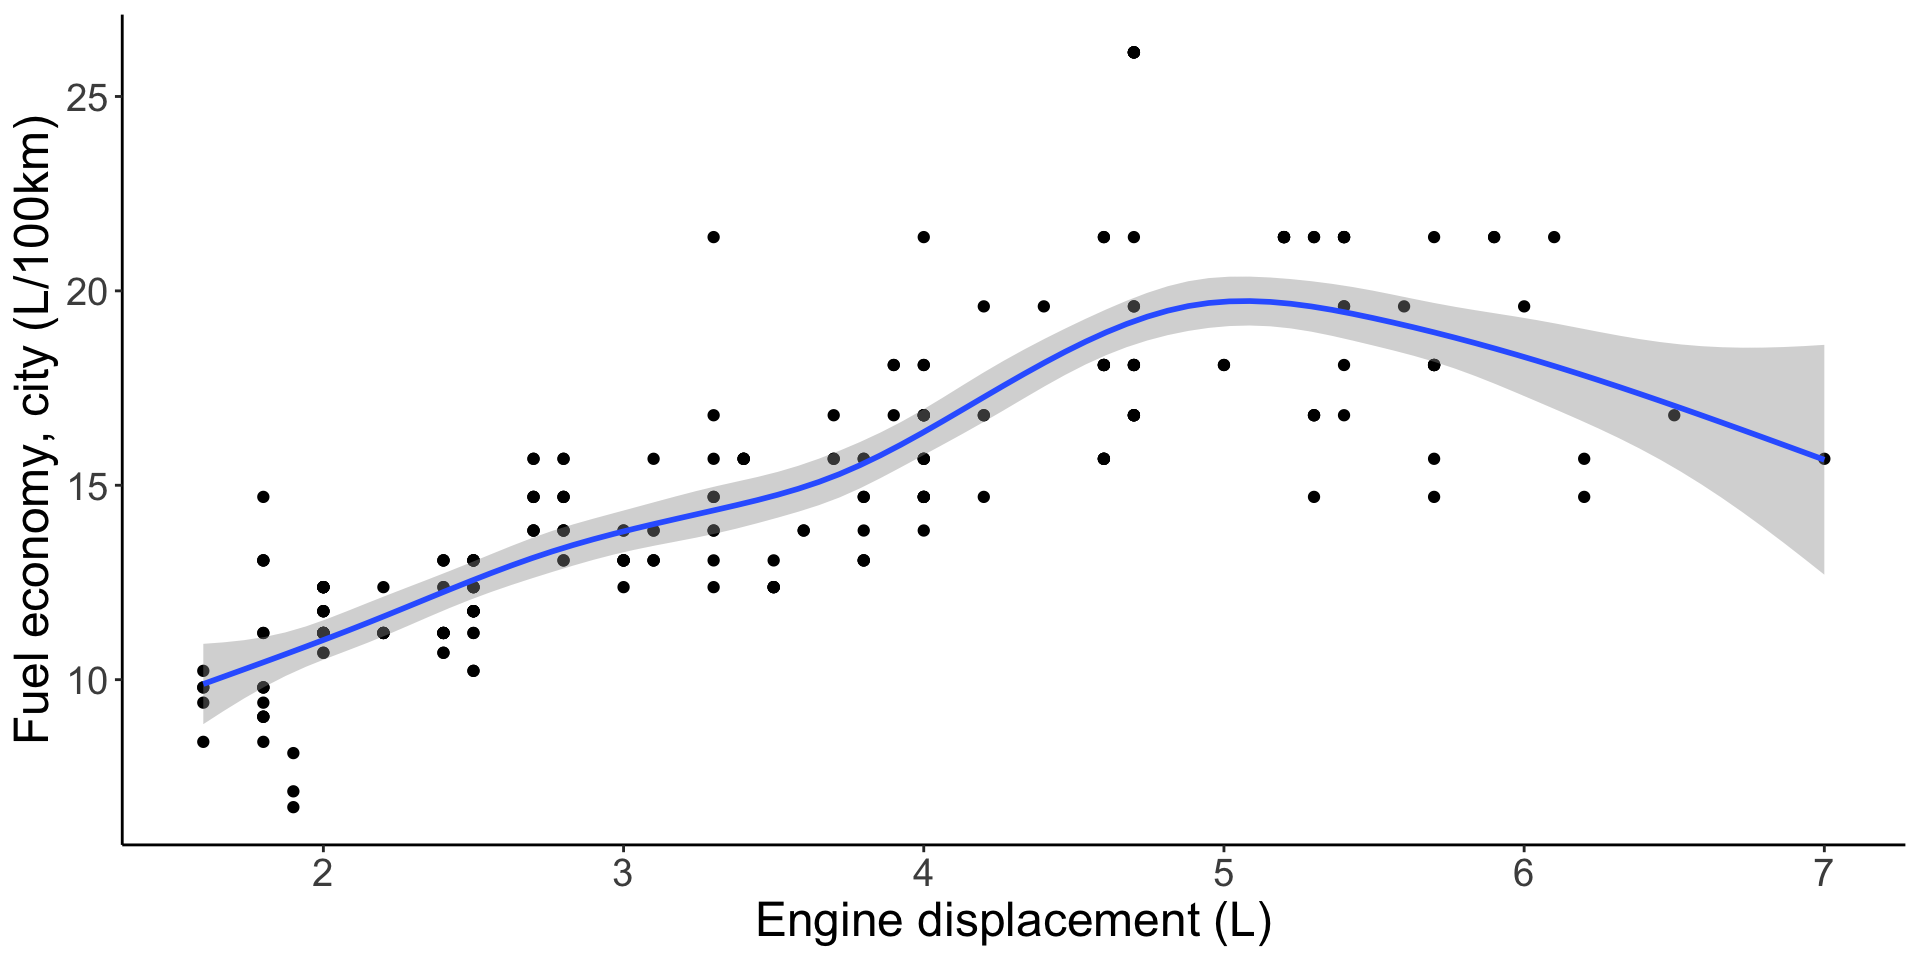
LOESS
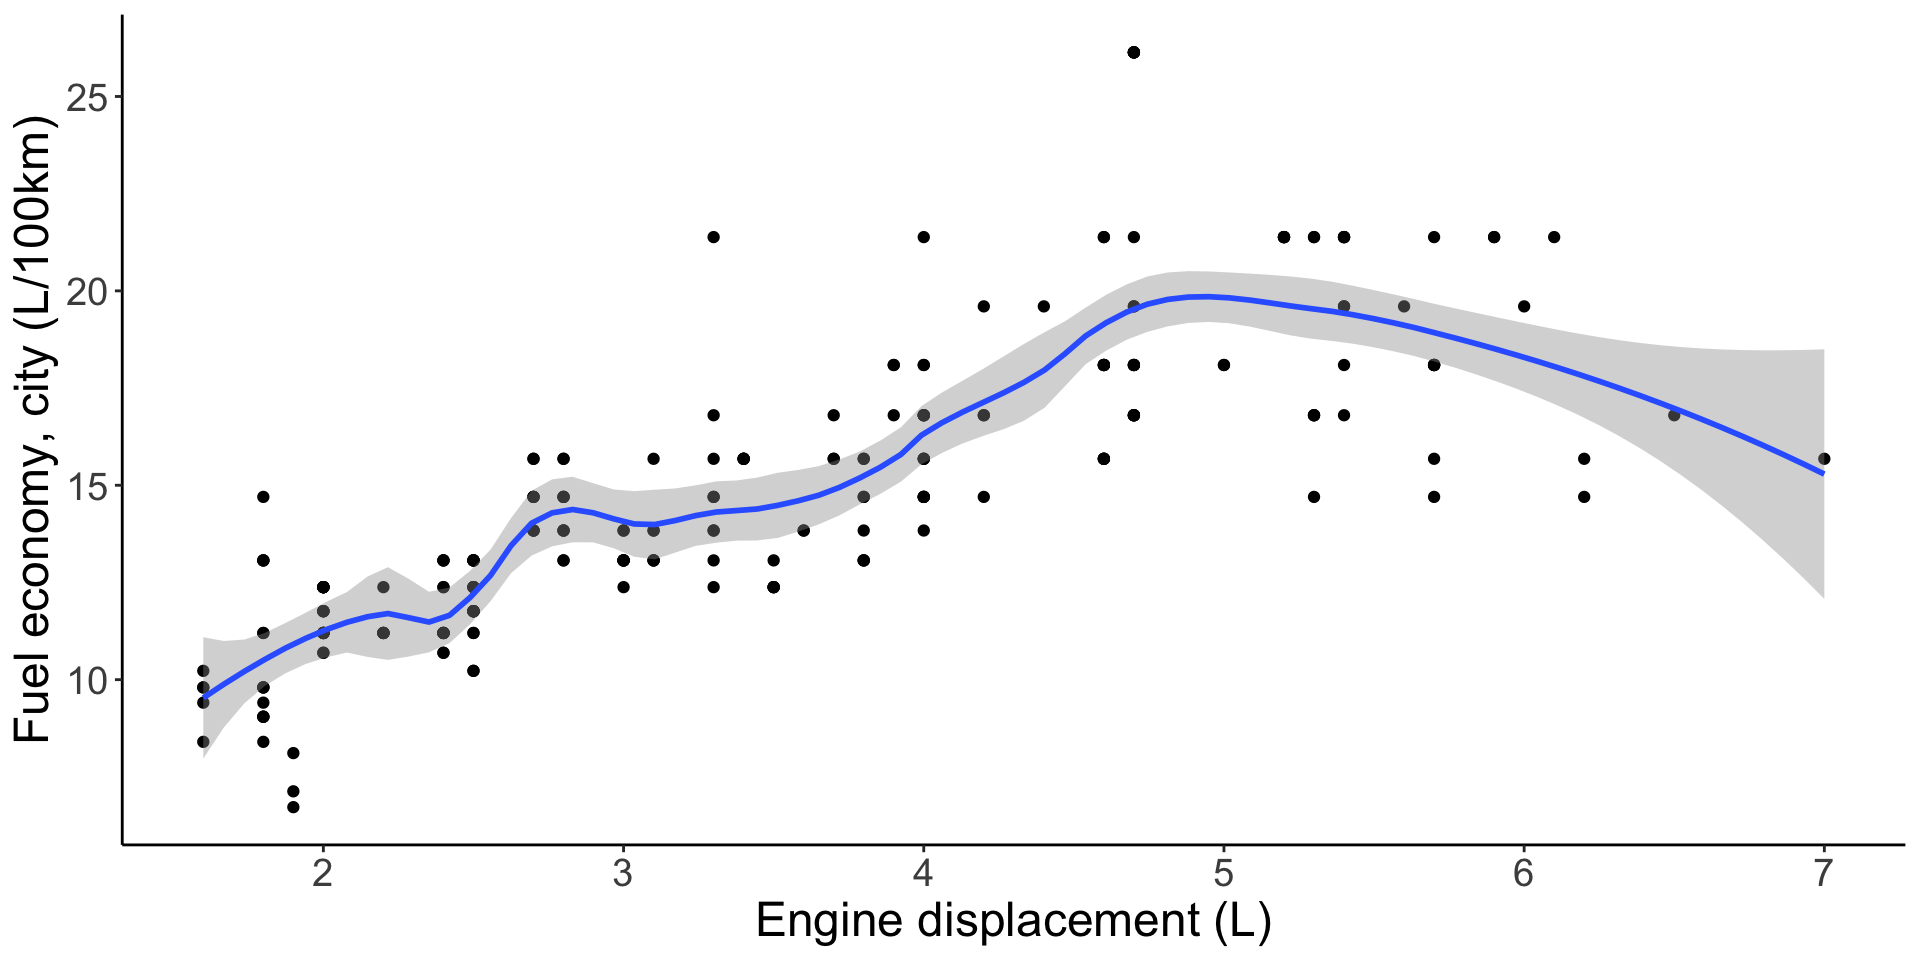
LOESS
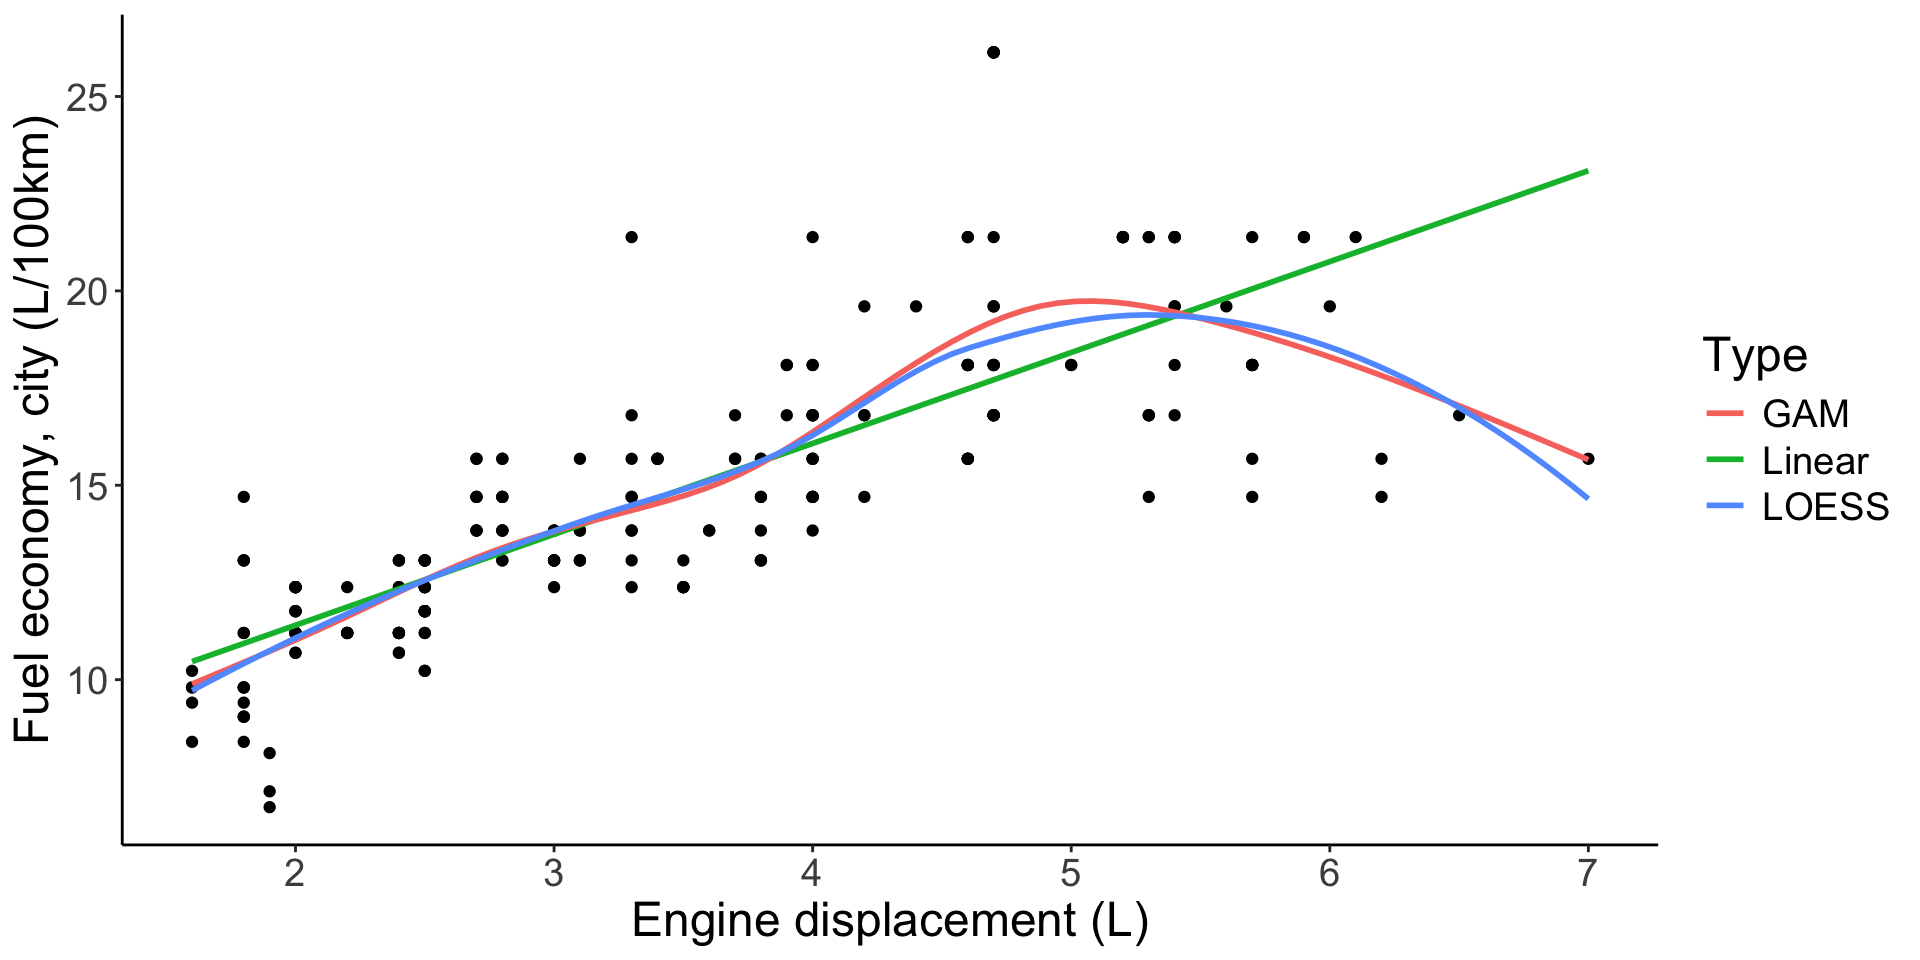
Putting multiple smooths on one plot
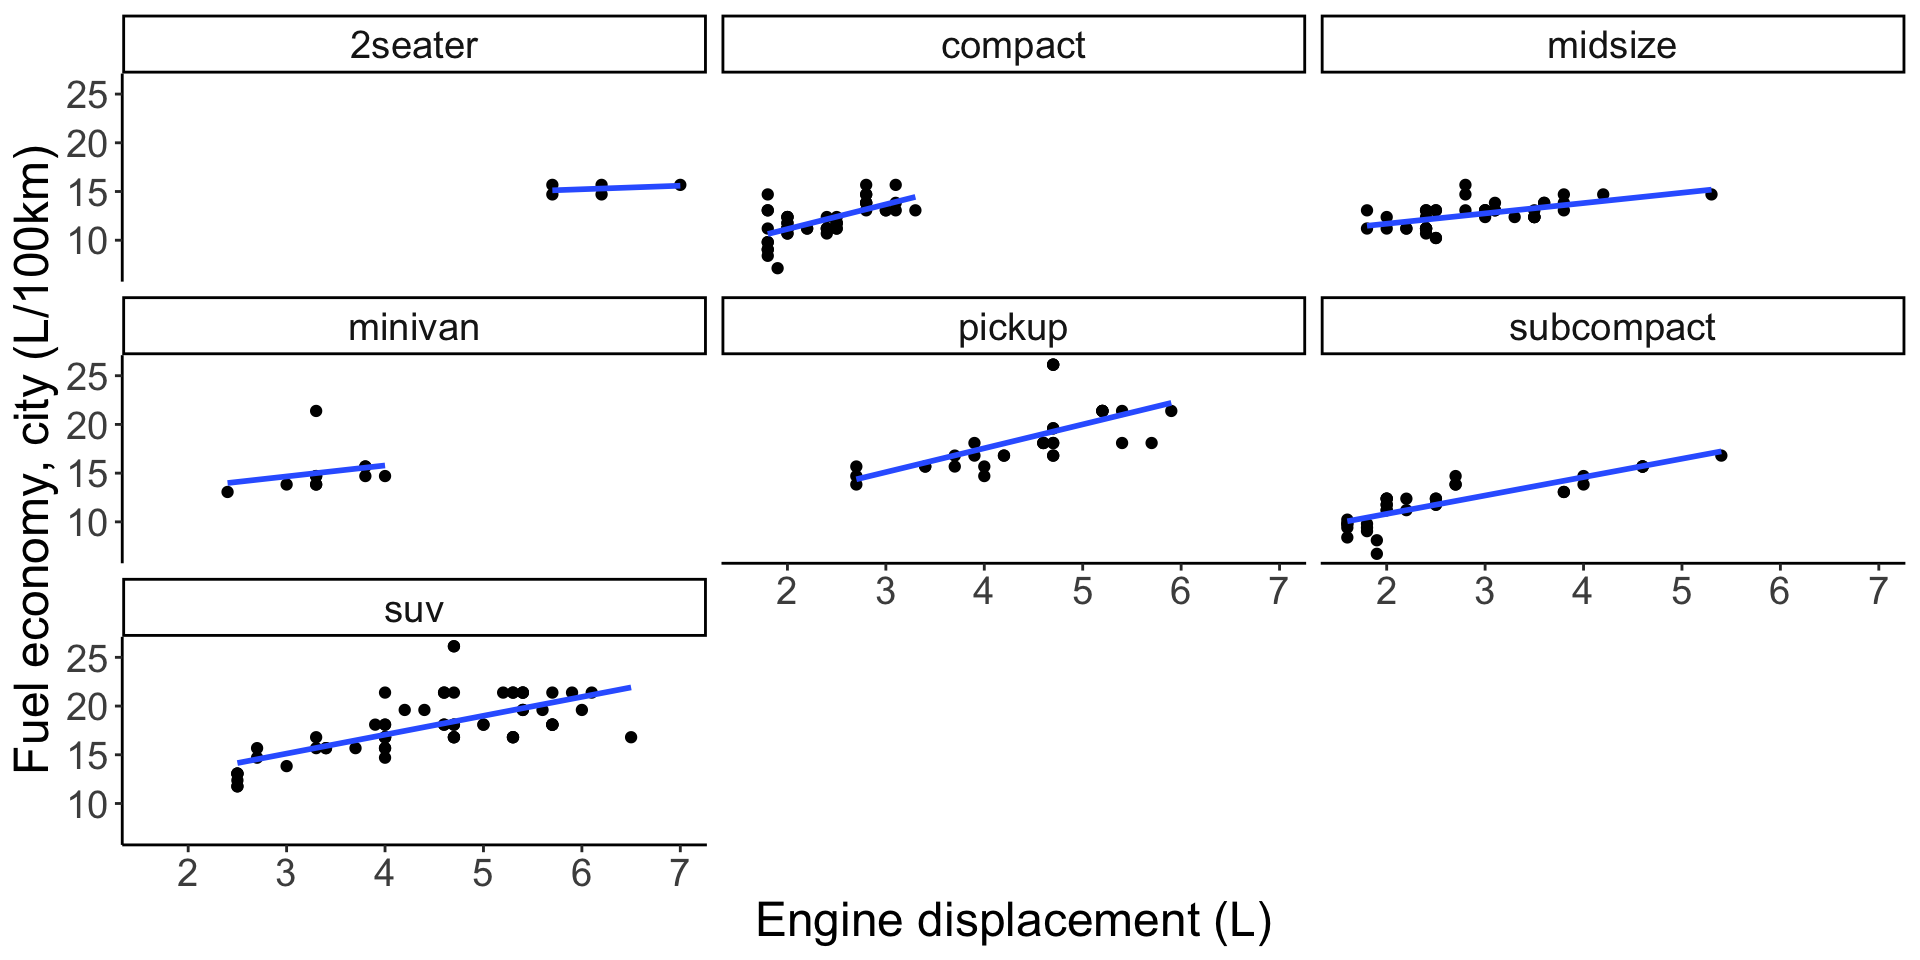
Smooths on facetted plots
Other customizations
Modelling x as a function of y
Modelling x as a function of y