penguins |>
filter(!is.na(bill_length_mm)) |>
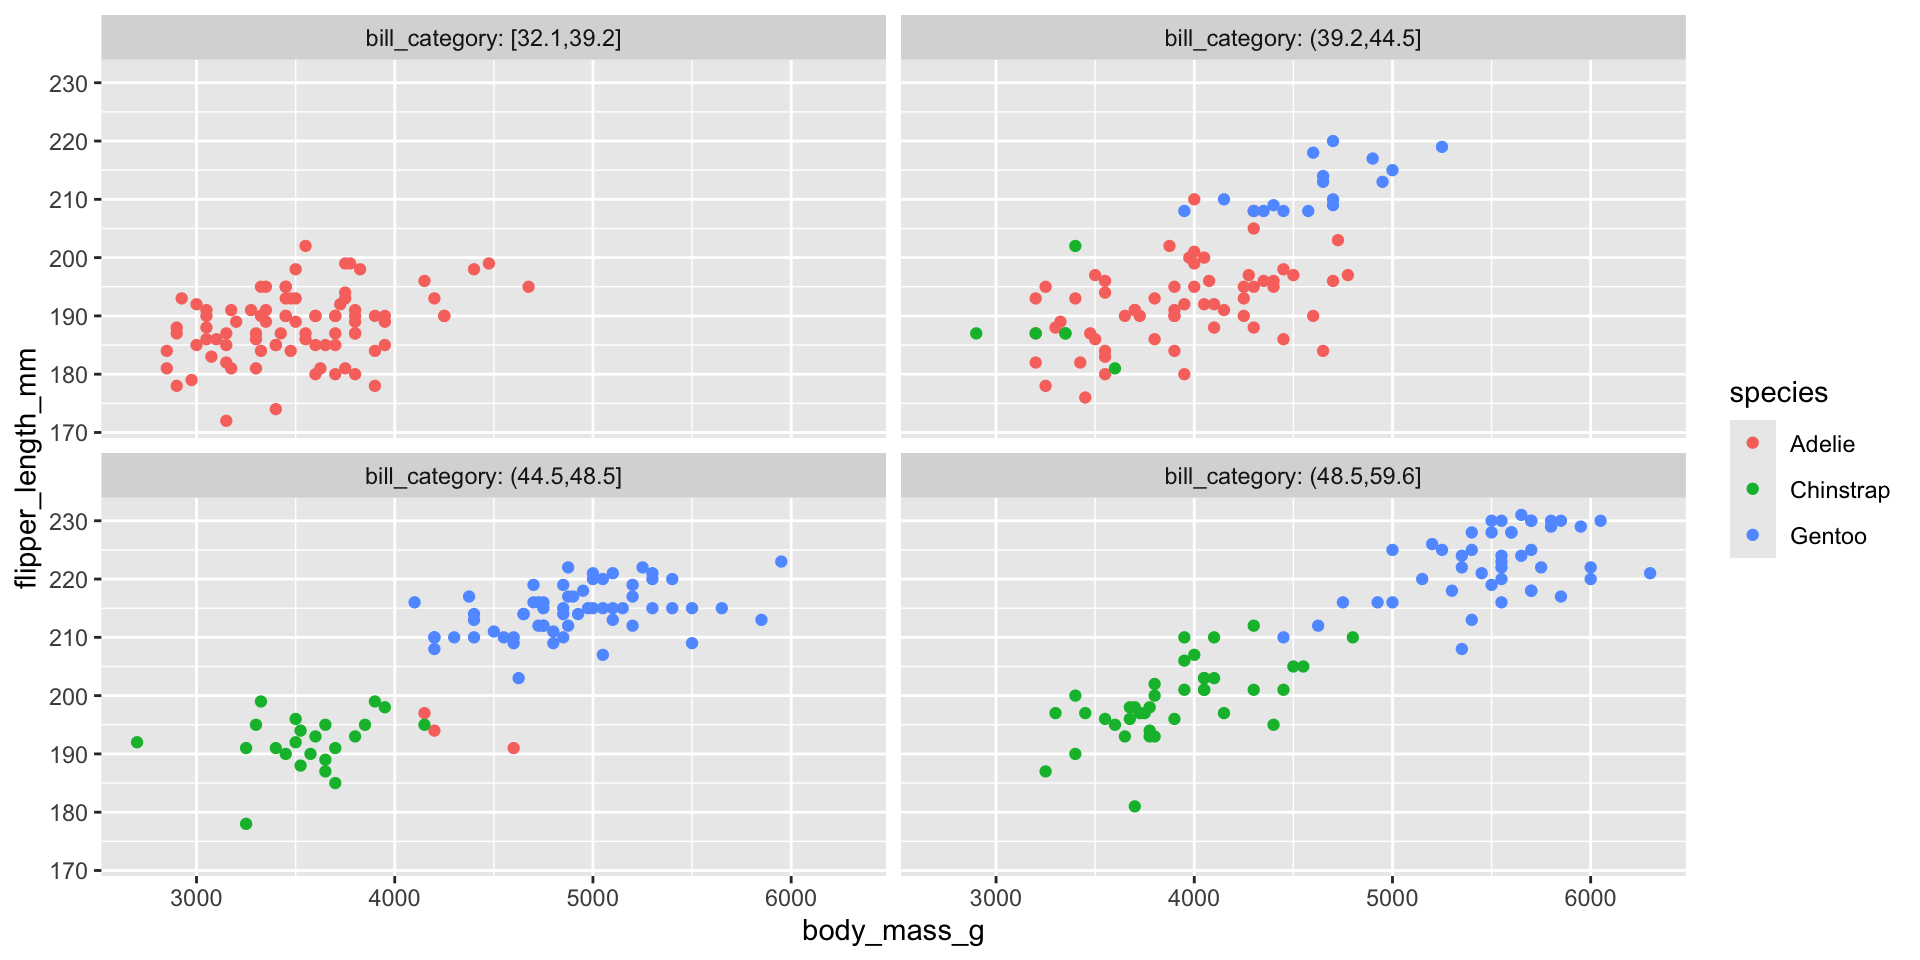
mutate(bill_category = cut_number(bill_length_mm, n = 4)) |>
select(species, bill_length_mm, bill_category, everything())
# A tibble: 342 × 9
   species bill_length_mm bill_category island   bill_depth_mm flipper_length_mm
   <fct>            <dbl> <fct>         <fct>            <dbl>             <int>
 1 Adelie            39.1 [32.1,39.2]   Torgers…          18.7               181
 2 Adelie            39.5 (39.2,44.5]   Torgers…          17.4               186
 3 Adelie            40.3 (39.2,44.5]   Torgers…          18                 195
 4 Adelie            36.7 [32.1,39.2]   Torgers…          19.3               193
 5 Adelie            39.3 (39.2,44.5]   Torgers…          20.6               190
 6 Adelie            38.9 [32.1,39.2]   Torgers…          17.8               181
 7 Adelie            39.2 [32.1,39.2]   Torgers…          19.6               195
 8 Adelie            34.1 [32.1,39.2]   Torgers…          18.1               193
 9 Adelie            42   (39.2,44.5]   Torgers…          20.2               190
10 Adelie            37.8 [32.1,39.2]   Torgers…          17.1               186
# ℹ 332 more rows
# ℹ 3 more variables: body_mass_g <int>, sex <fct>, year <int>